Airbnb market analytics
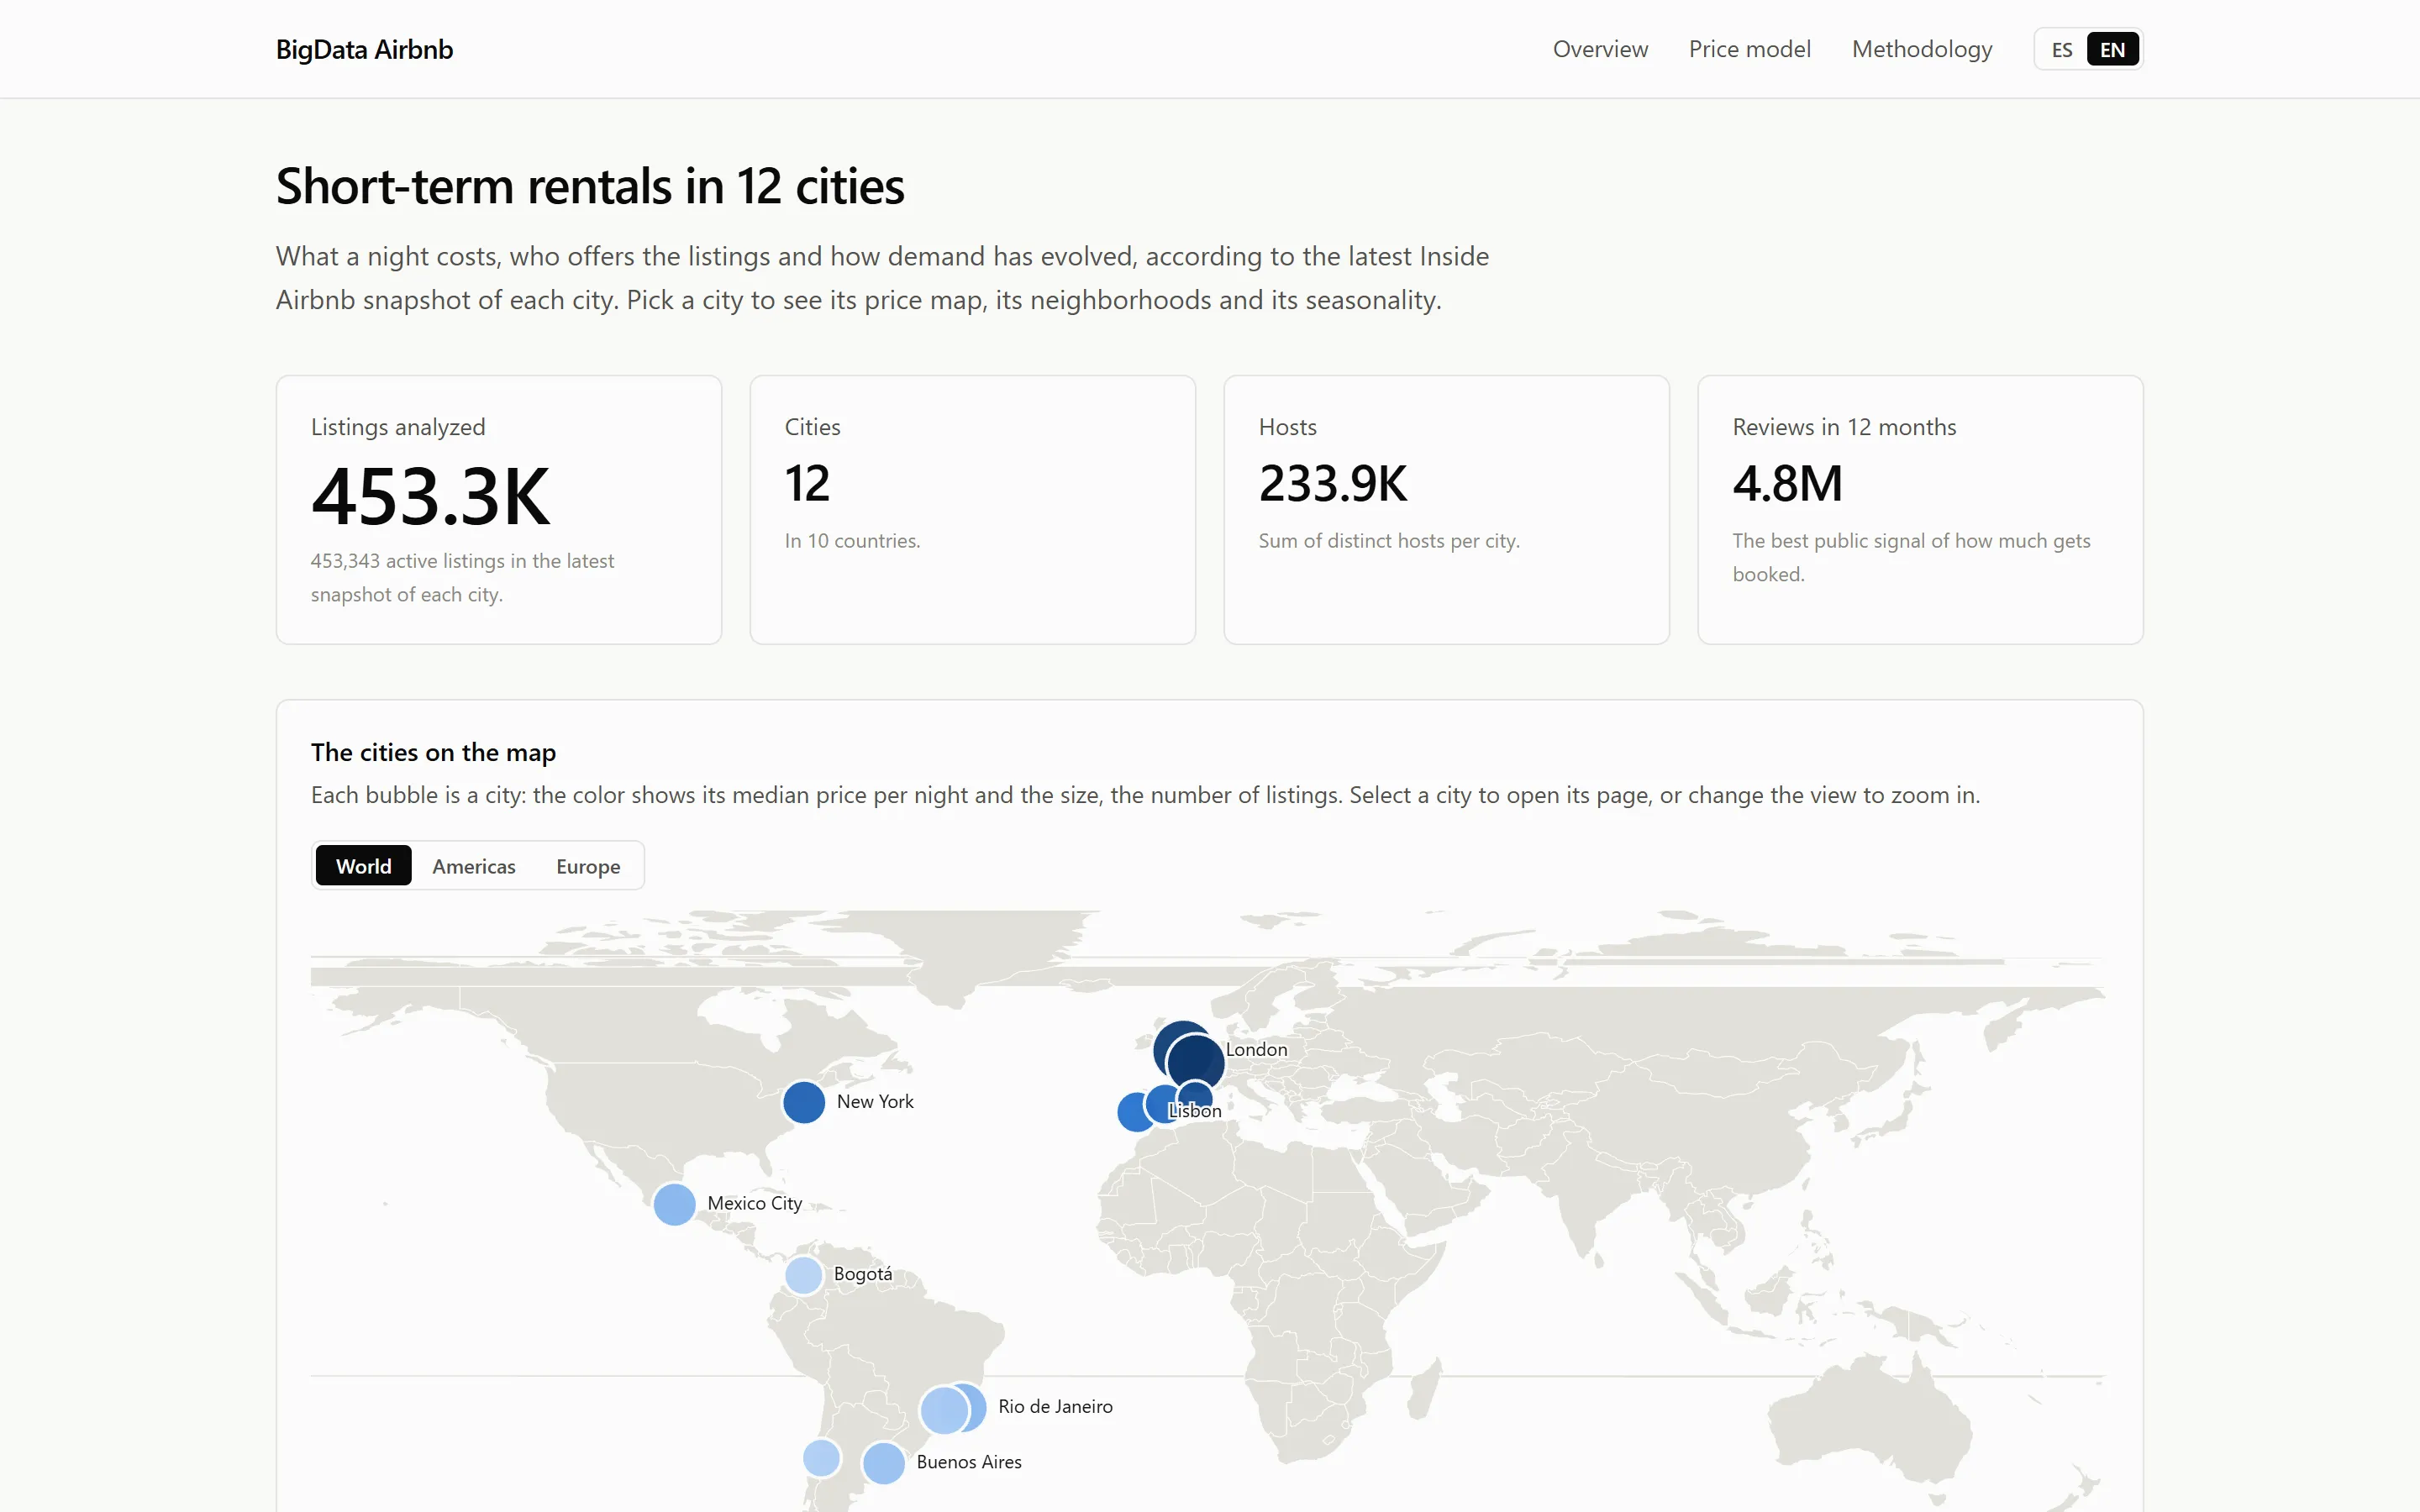
Batch pipeline on Apache Spark and HDFS that processes Inside Airbnb open data for 12 cities, trains a price model and publishes the results to a web dashboard.
- Role
- University team project with five students in 2025; complete redesign and sole author of the current version in 2026
- Period
- Sep 2025 — Nov 2026
- Status
- Completed
- Stack
- Apache Spark
- HDFS
- Spark ML
- Python
- PostgreSQL
- Next.js
- Docker
The project started in 2025 as a team assignment for the Big Data course at Universidad Privada Antenor Orrego: a Kafka and Spark pipeline over the listings of Santiago de Chile. In November 2026 I rebuilt it from scratch on my own. The current version downloads the open data of Inside Airbnb for 12 cities, processes it with Apache Spark on HDFS, trains a price model and publishes the results to a web dashboard in English and Spanish.
A full run takes 453,343 listings, 165.5 million calendar rows and 17.9 million reviews from the source files to the site, in about 16 minutes on a laptop.
Architecture
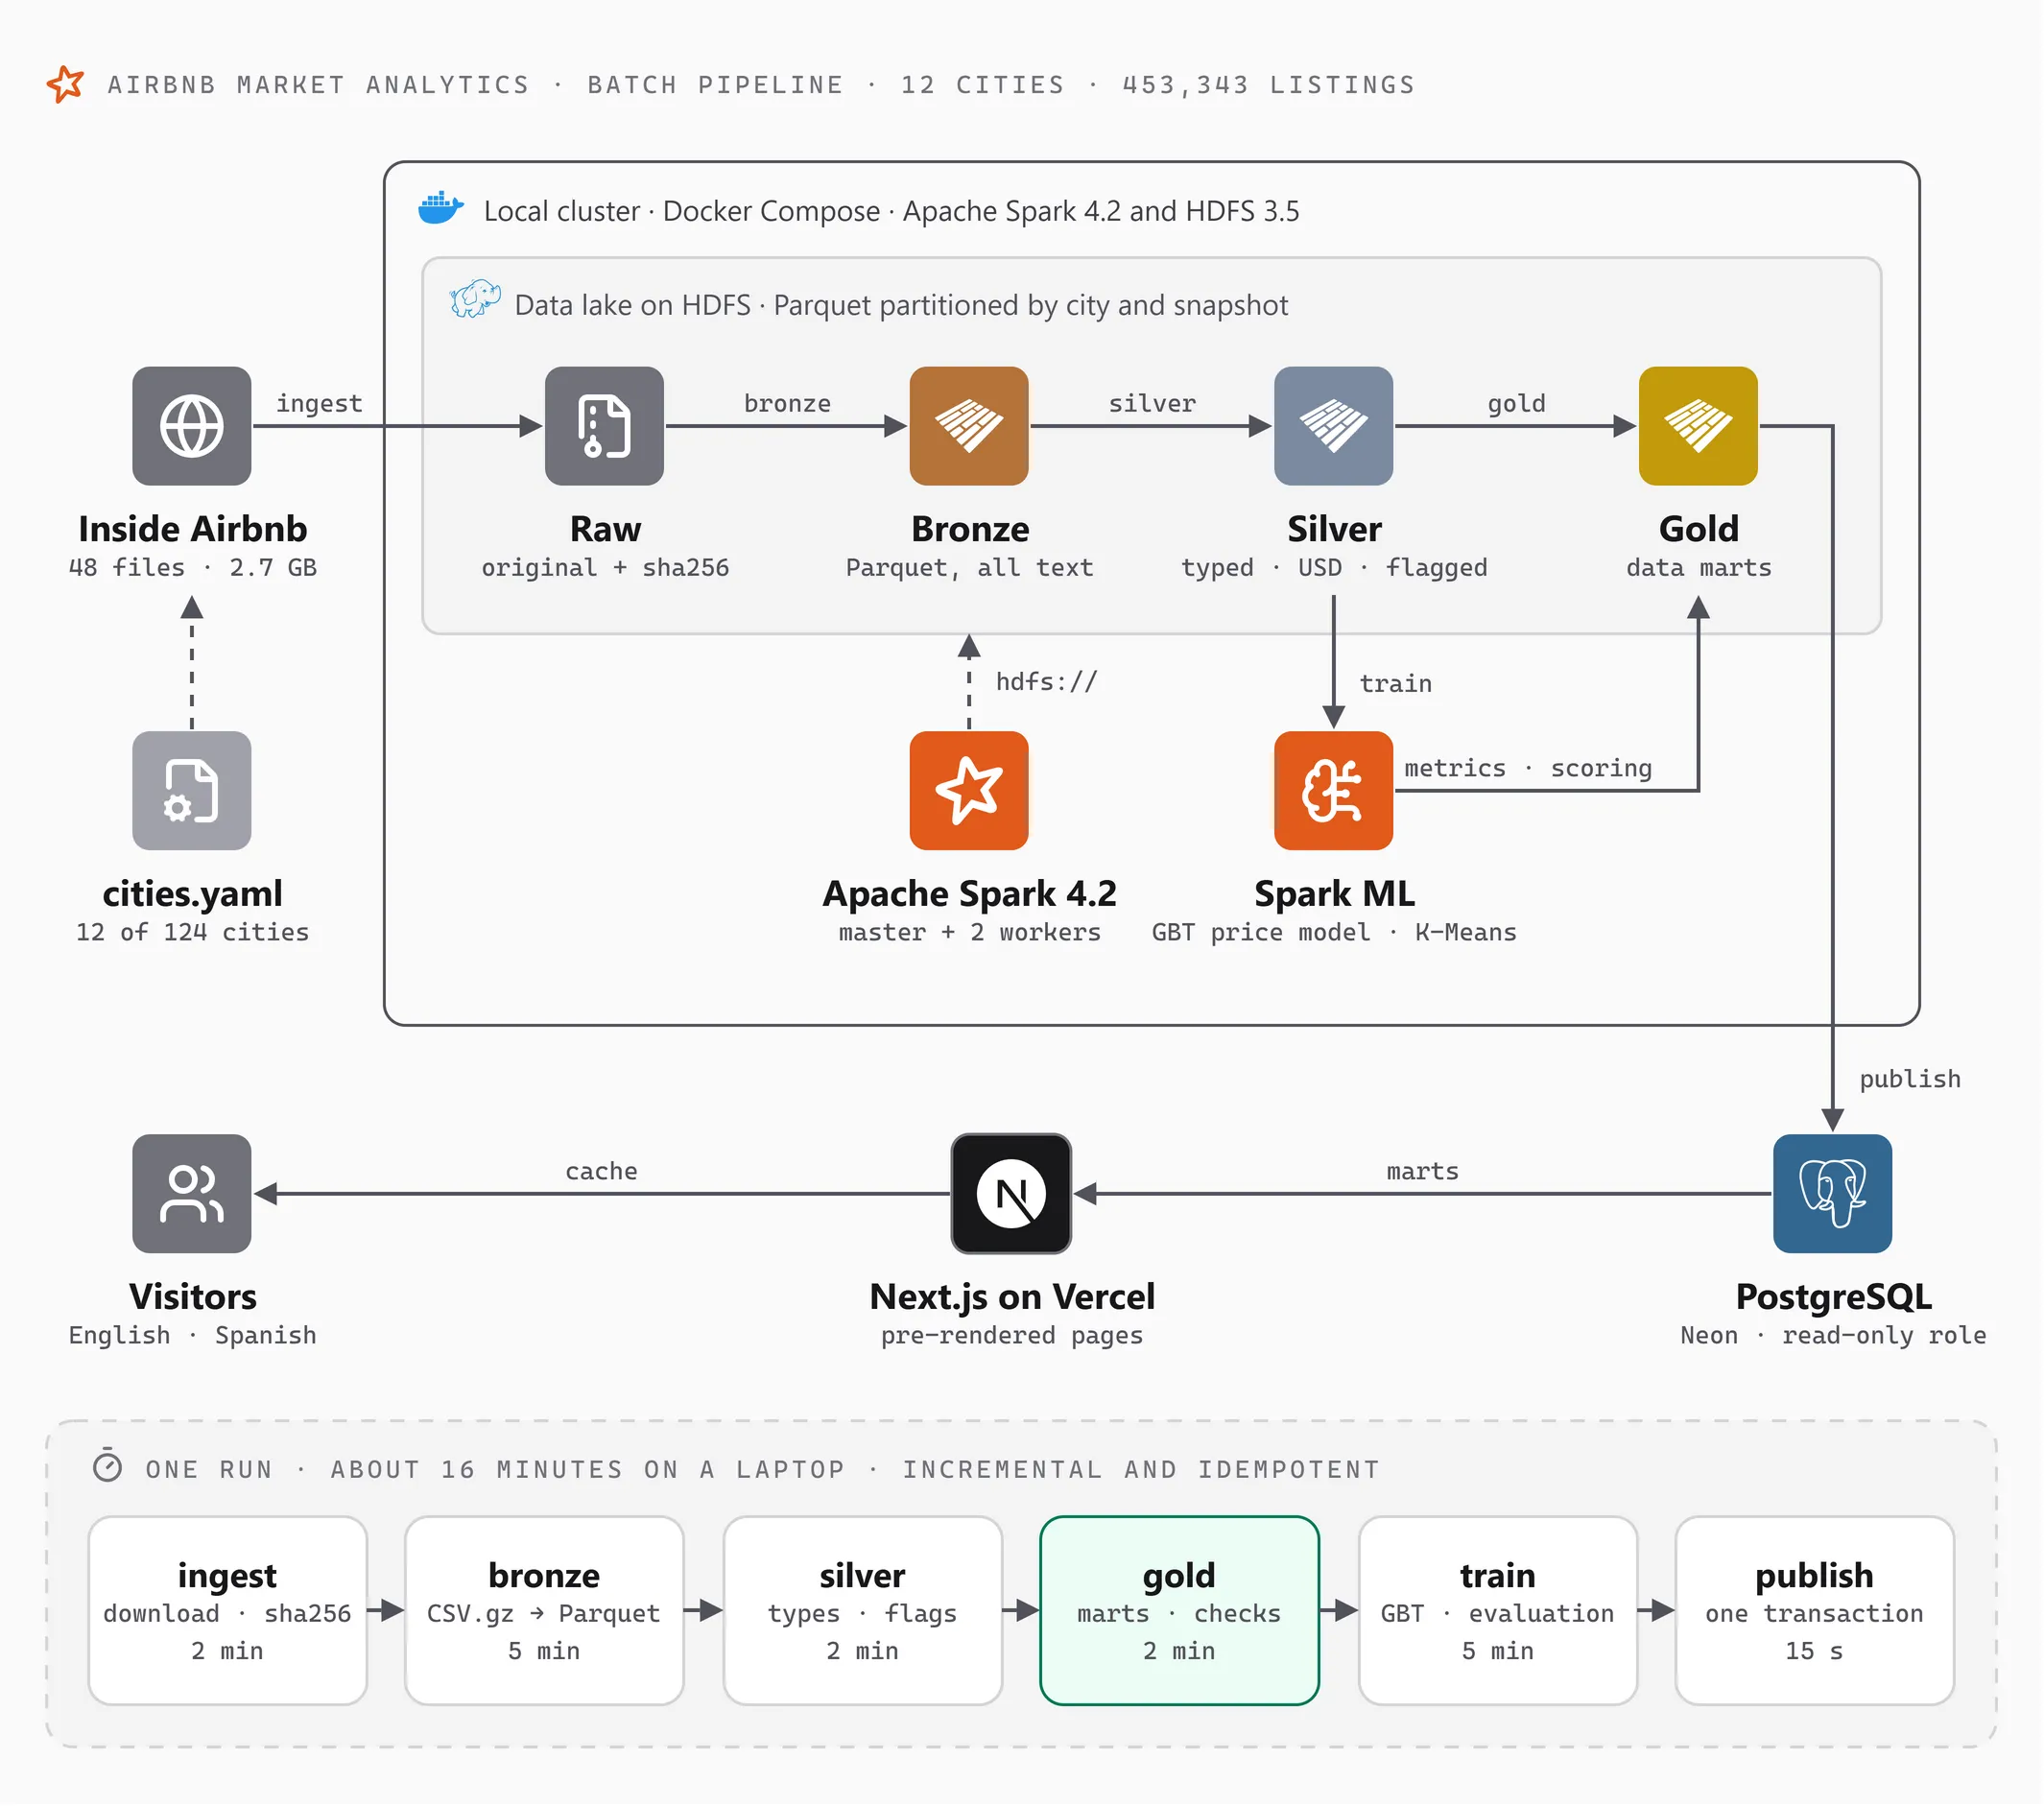
Each layer of the lake has a single responsibility:
- Raw. The source file untouched, with its size and sha256. Inside Airbnb only publishes the latest snapshot of each city, so this zone is also the historical archive.
- Bronze. The same content in Parquet, with every column as text. Only the format changes, and each file is fitted to a column contract: a schema change at the source does not shift data.
- Silver. Typed tables, with prices converted to US dollars, no duplicates and quality flags.
- Gold. Small aggregates, one for each question the dashboard asks. The site never touches raw data.
Everything runs on a local cluster defined with Docker Compose: HDFS, Spark in standalone mode with a master and two workers, and a PostgreSQL database that mirrors the production schema. The root of the lake is a Hadoop URI, so the same code works on hdfs://, s3a:// or abfss://.
Engineering decisions
- Incremental and idempotent. Each stage processes only the city and snapshot partitions that are missing, and running it again duplicates nothing. When the source publishes a new snapshot, it is stored next to the previous ones and the marts move to the most recent.
- The CSV is read according to RFC 4180. The Santiago file holds 18,904 records in 32,585 lines, because there are line breaks inside fields. The original version read it line by line and the columns shifted. That case now has a regression test.
- Doubtful rows are flagged, not deleted. An outlier price, coordinates outside the city or an invalid room type stay as flags in Silver, and each consumer decides what to filter.
- Validations that stop the publication. Duplicate listings, invalid room types, cities without data or repeated calendar dates halt the pipeline before anything reaches the site.
- Performance without Python UDFs. Every transformation is a native Spark expression. The calendar is reduced to listing by month on its way to Silver, before any join, and Bronze unions the compressed files, which cannot be split, into a single plan so they are processed in parallel.
- A new city is one configuration entry. The source catalog has 124 cities; adding one to the
cities.yamlfile and running again processes only that city.
The pipeline running
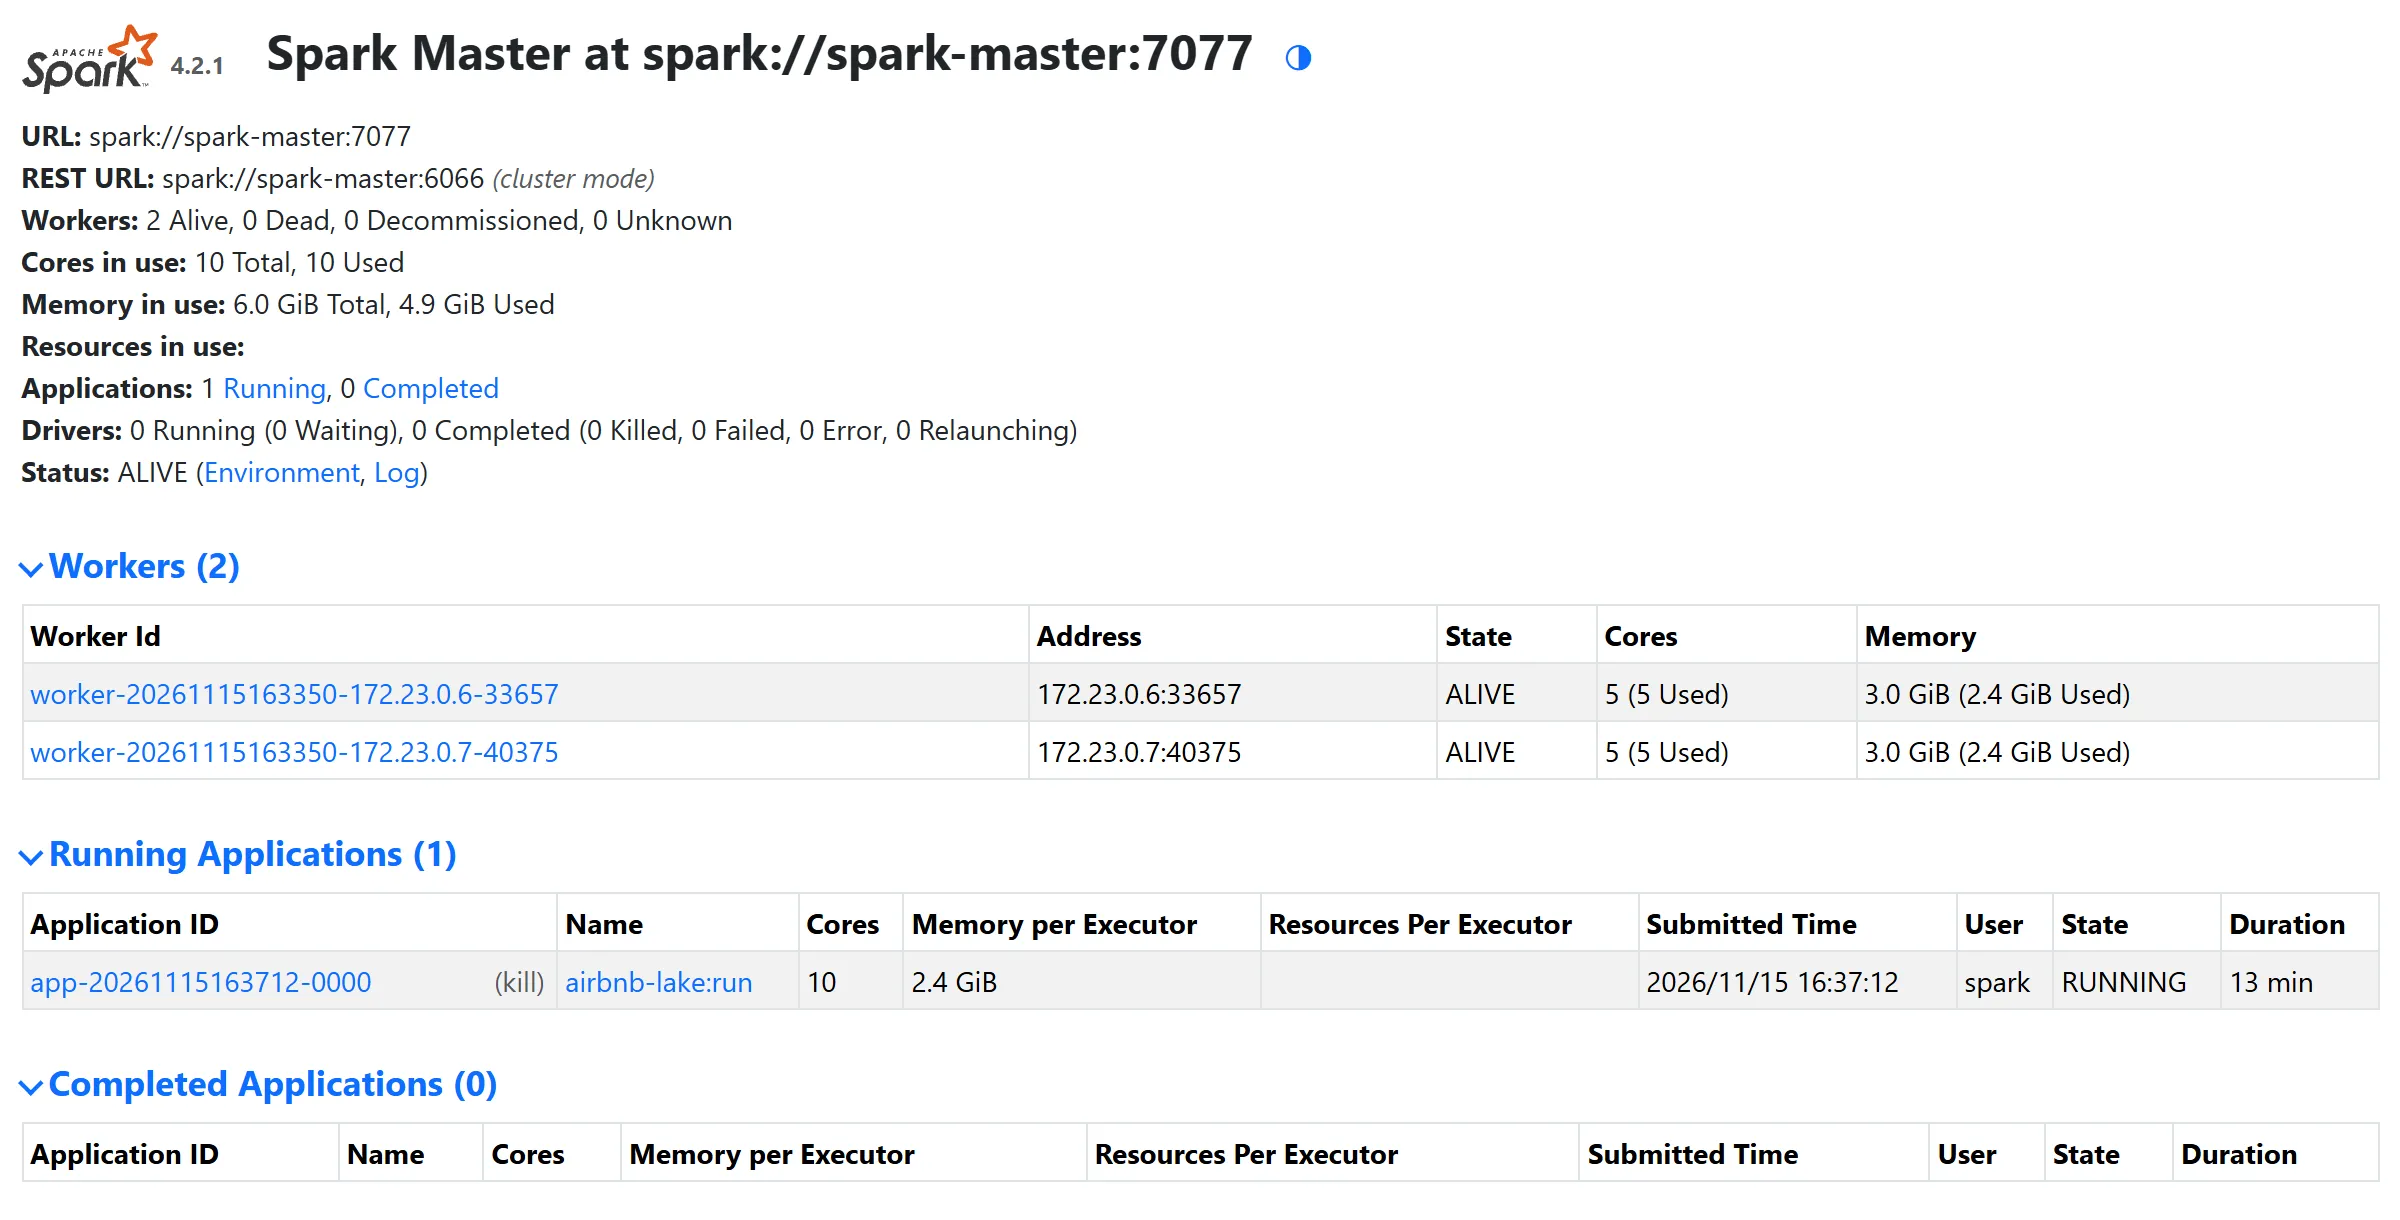
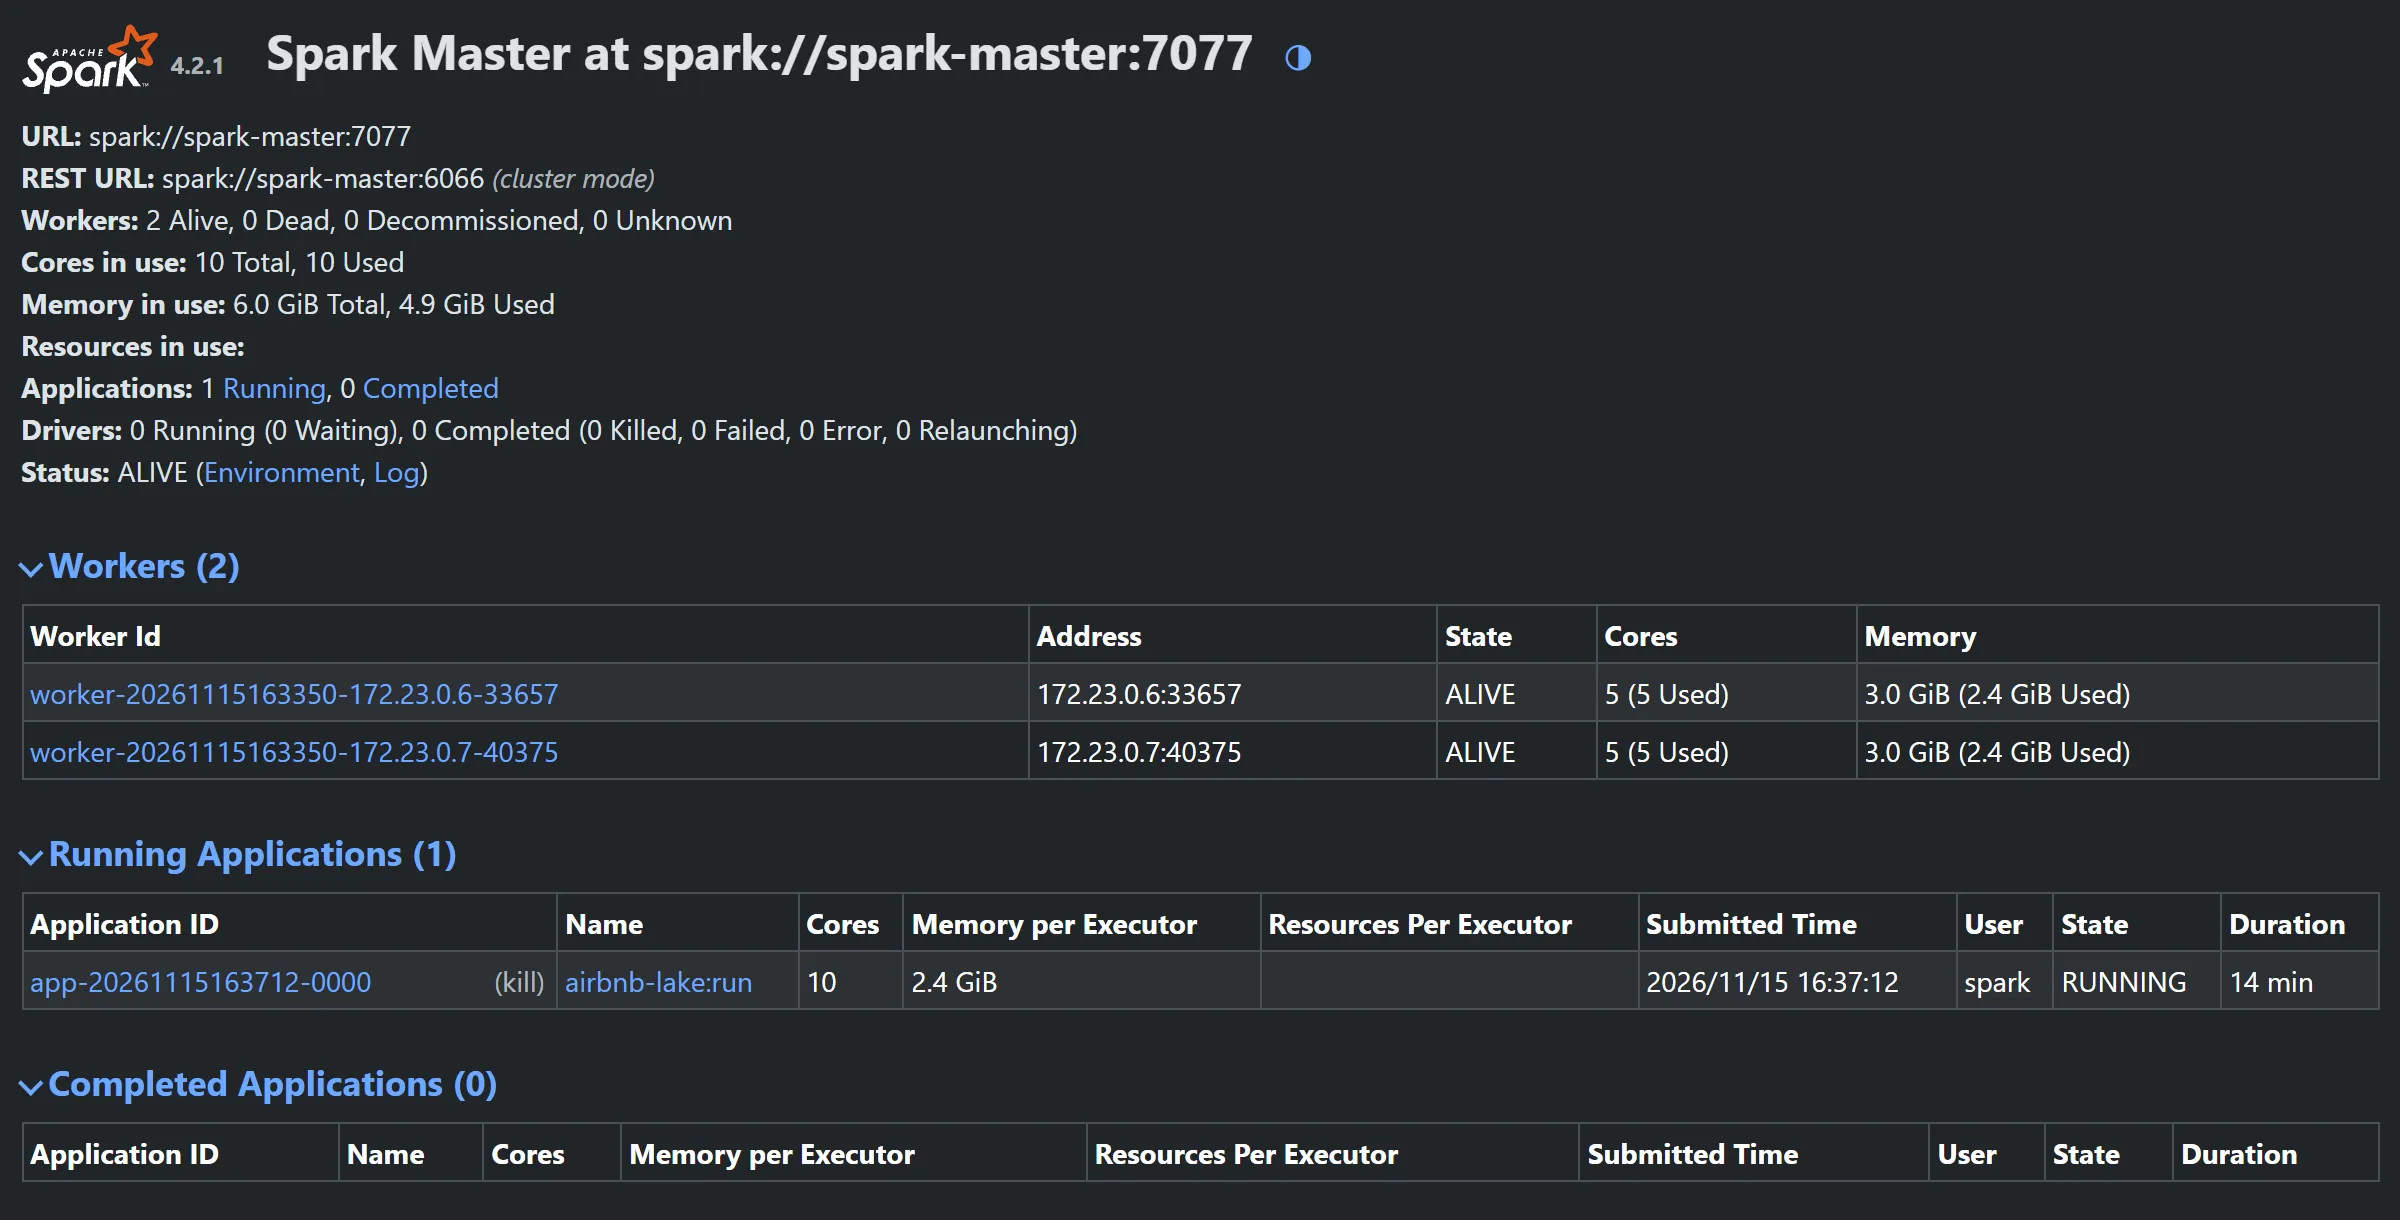
What follows is the record of a full run on the local cluster, from 15 November 2026. The Spark master, with its two workers and the ten cores taken by the application:
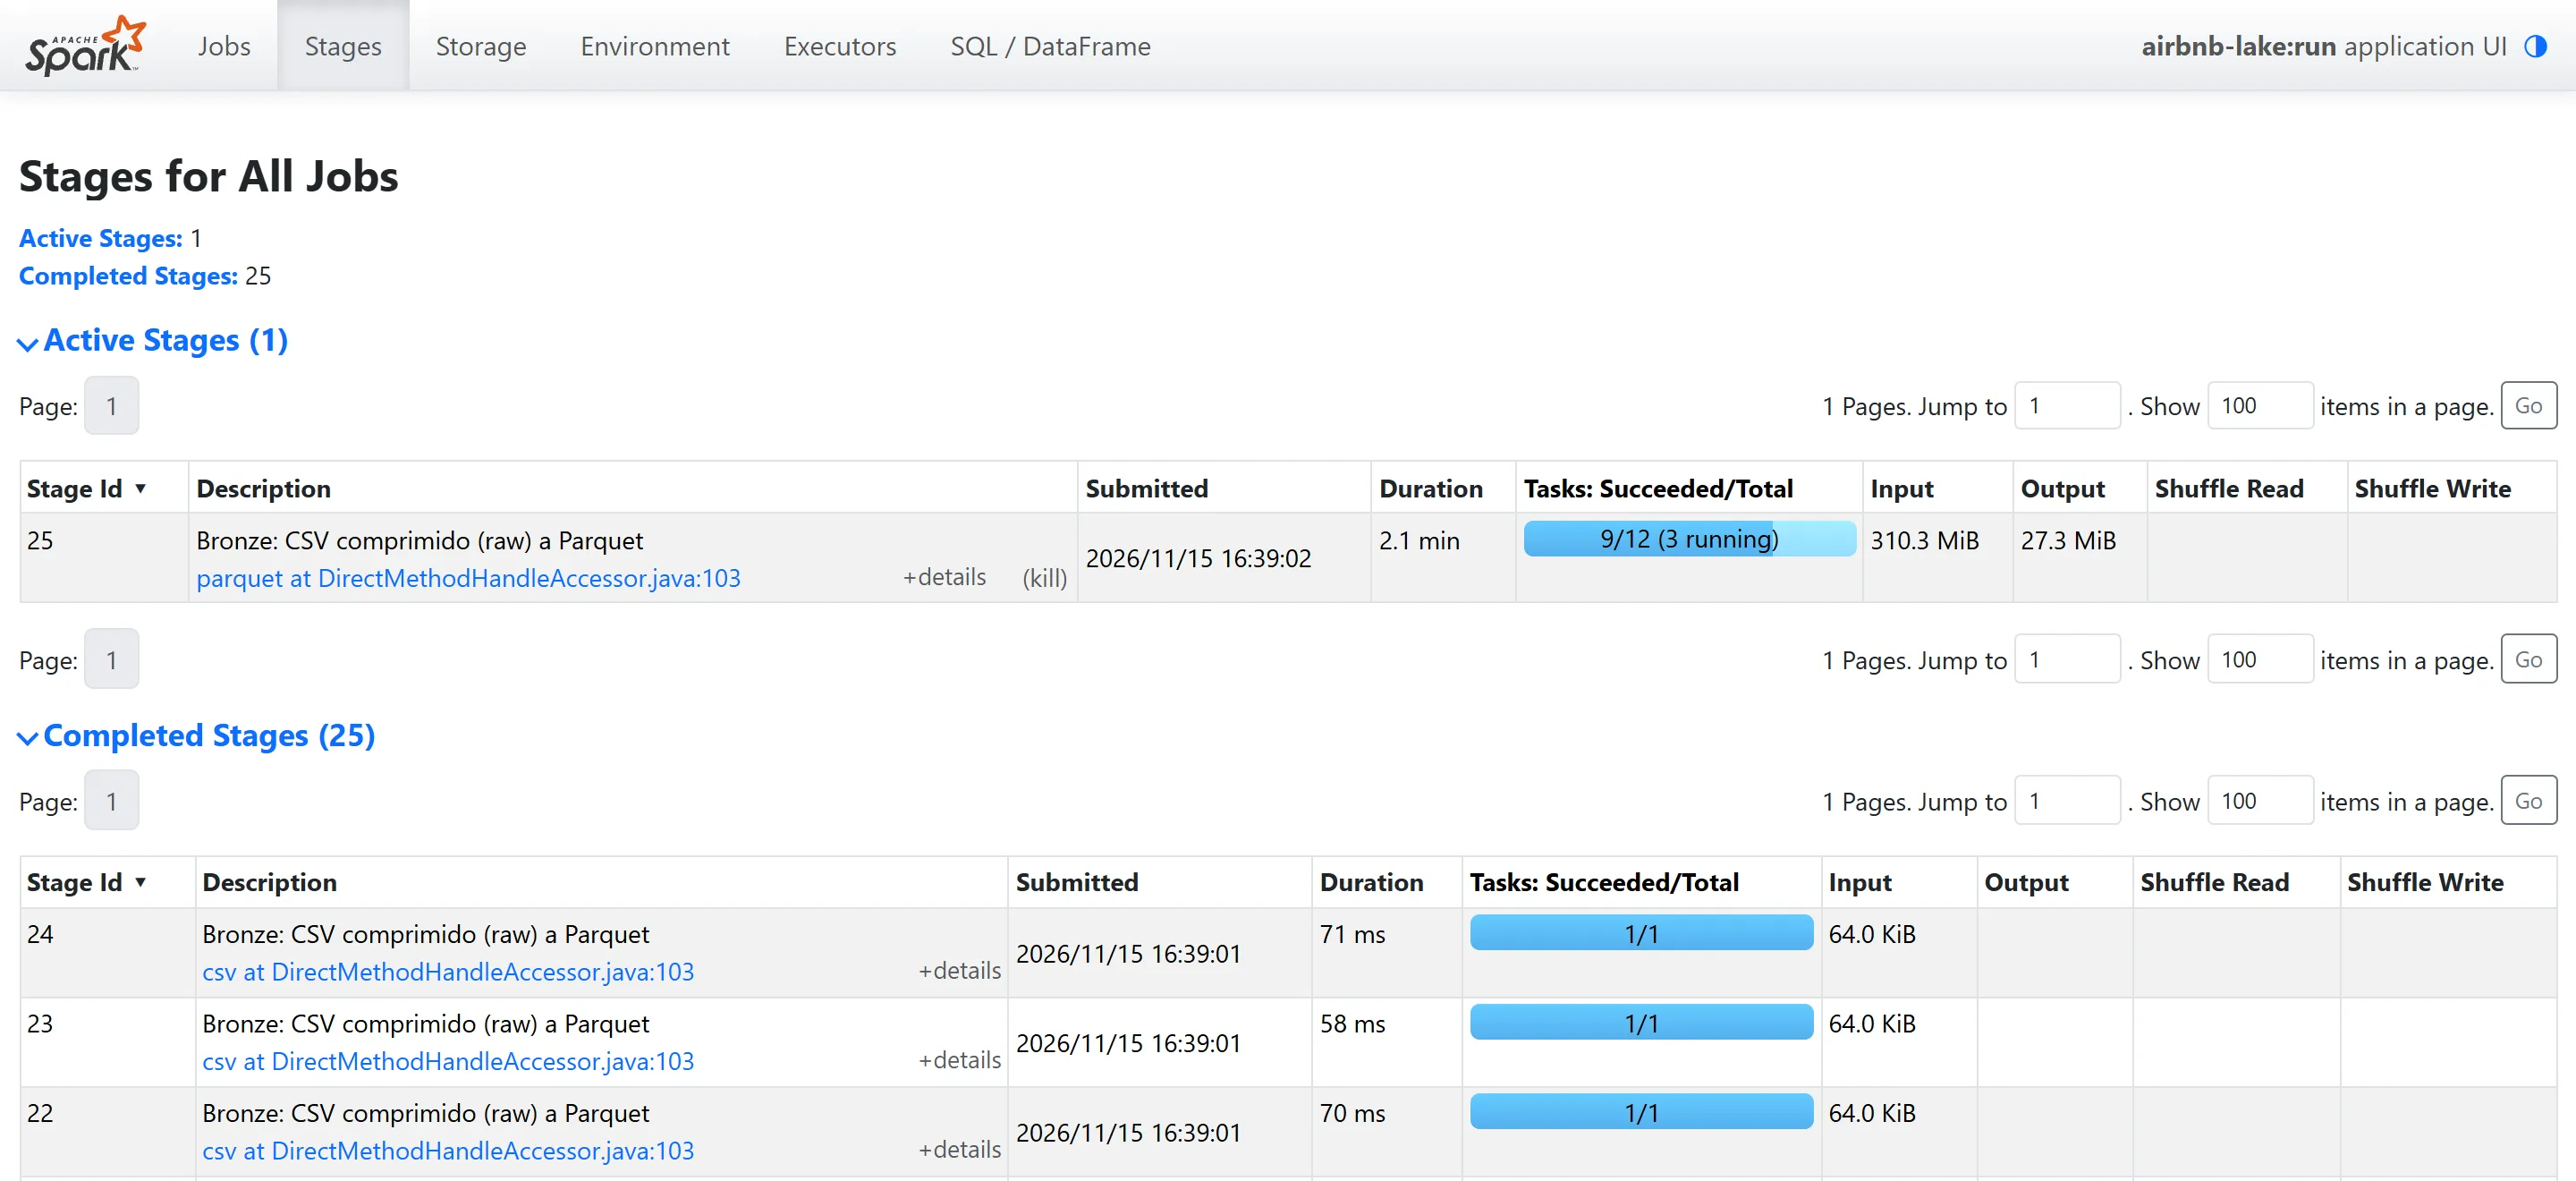
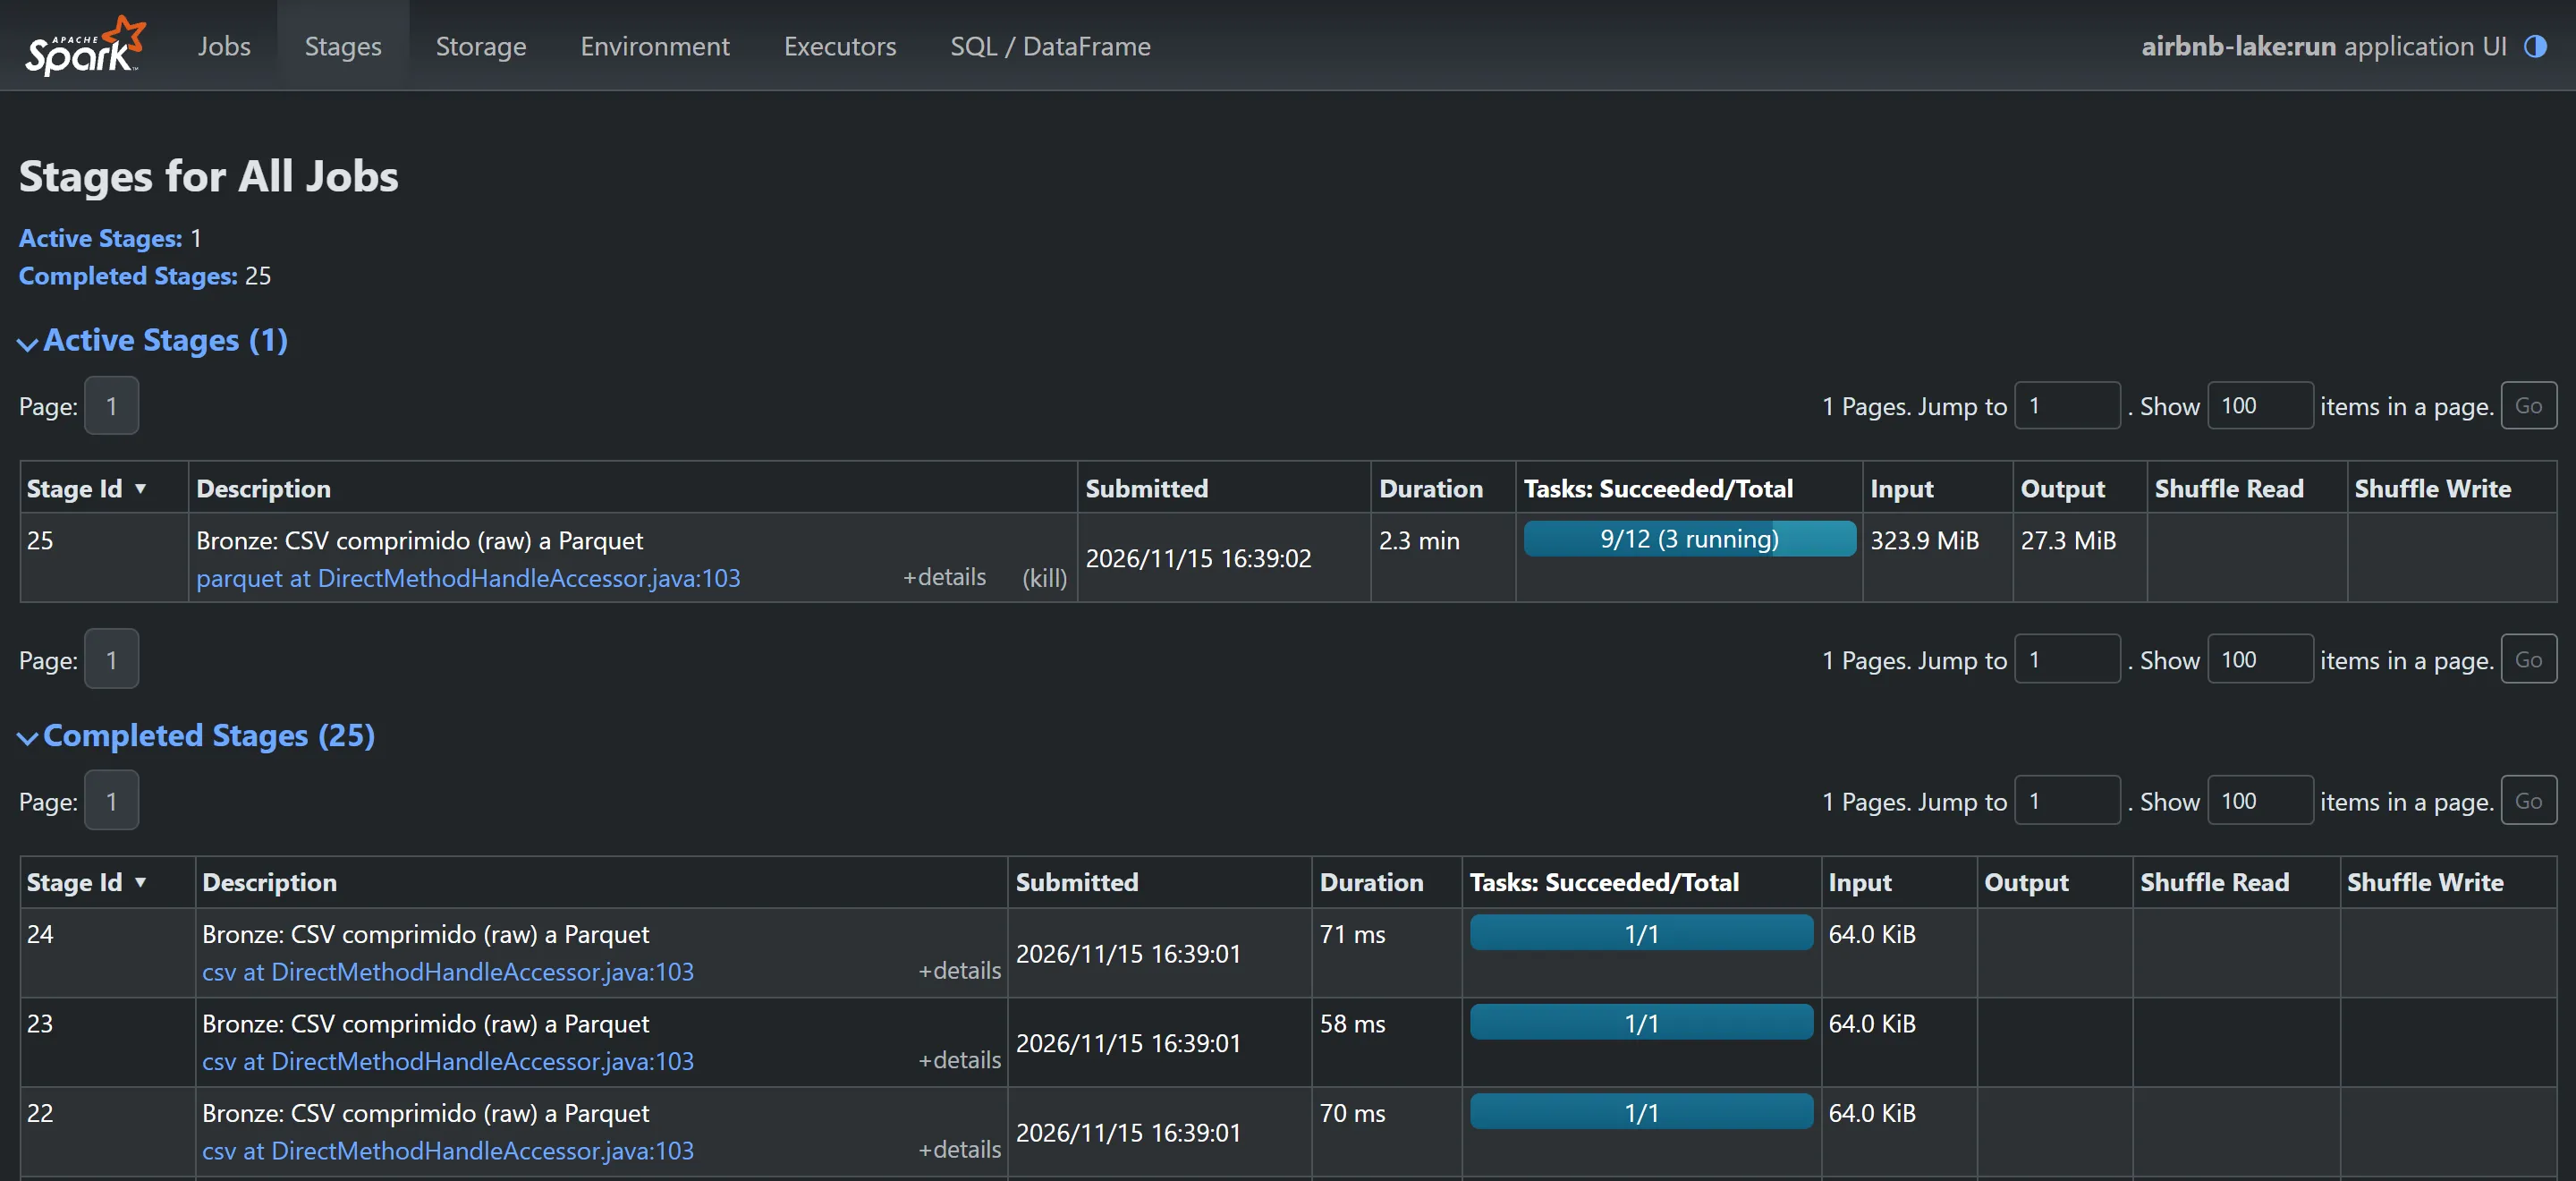
In bronze, each compressed file from the source is one task, and the tasks are spread over the two executors:
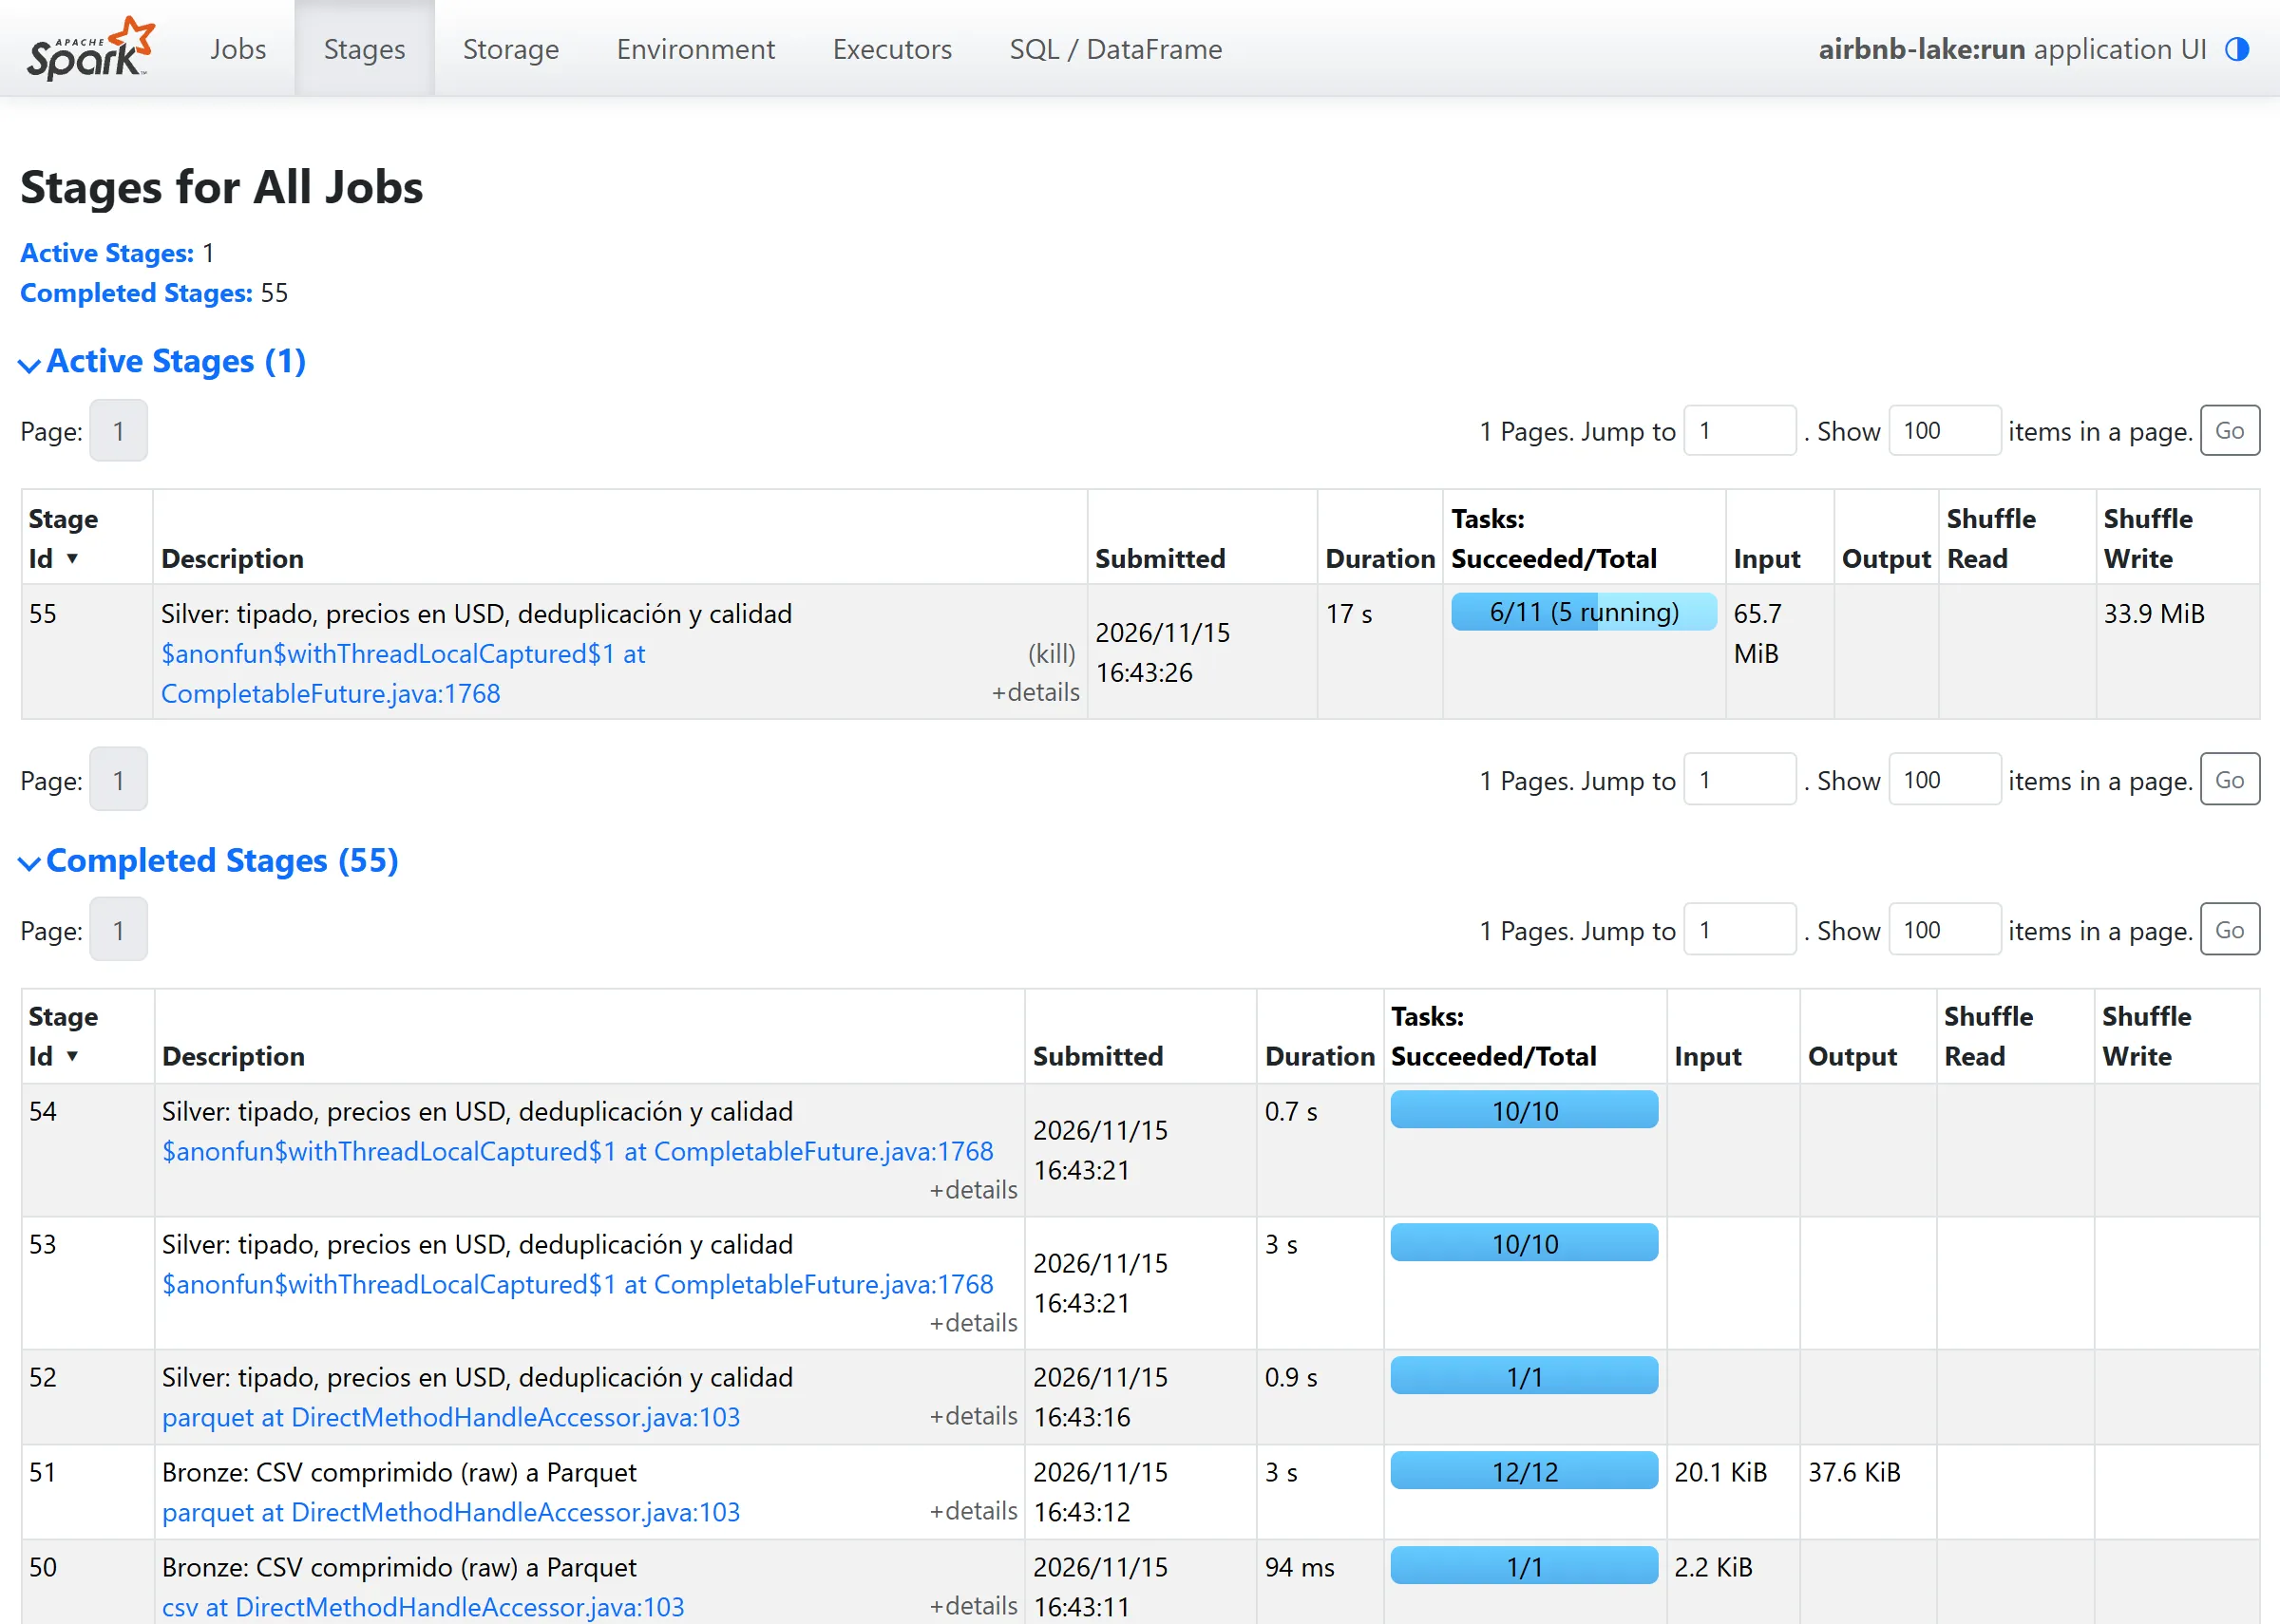
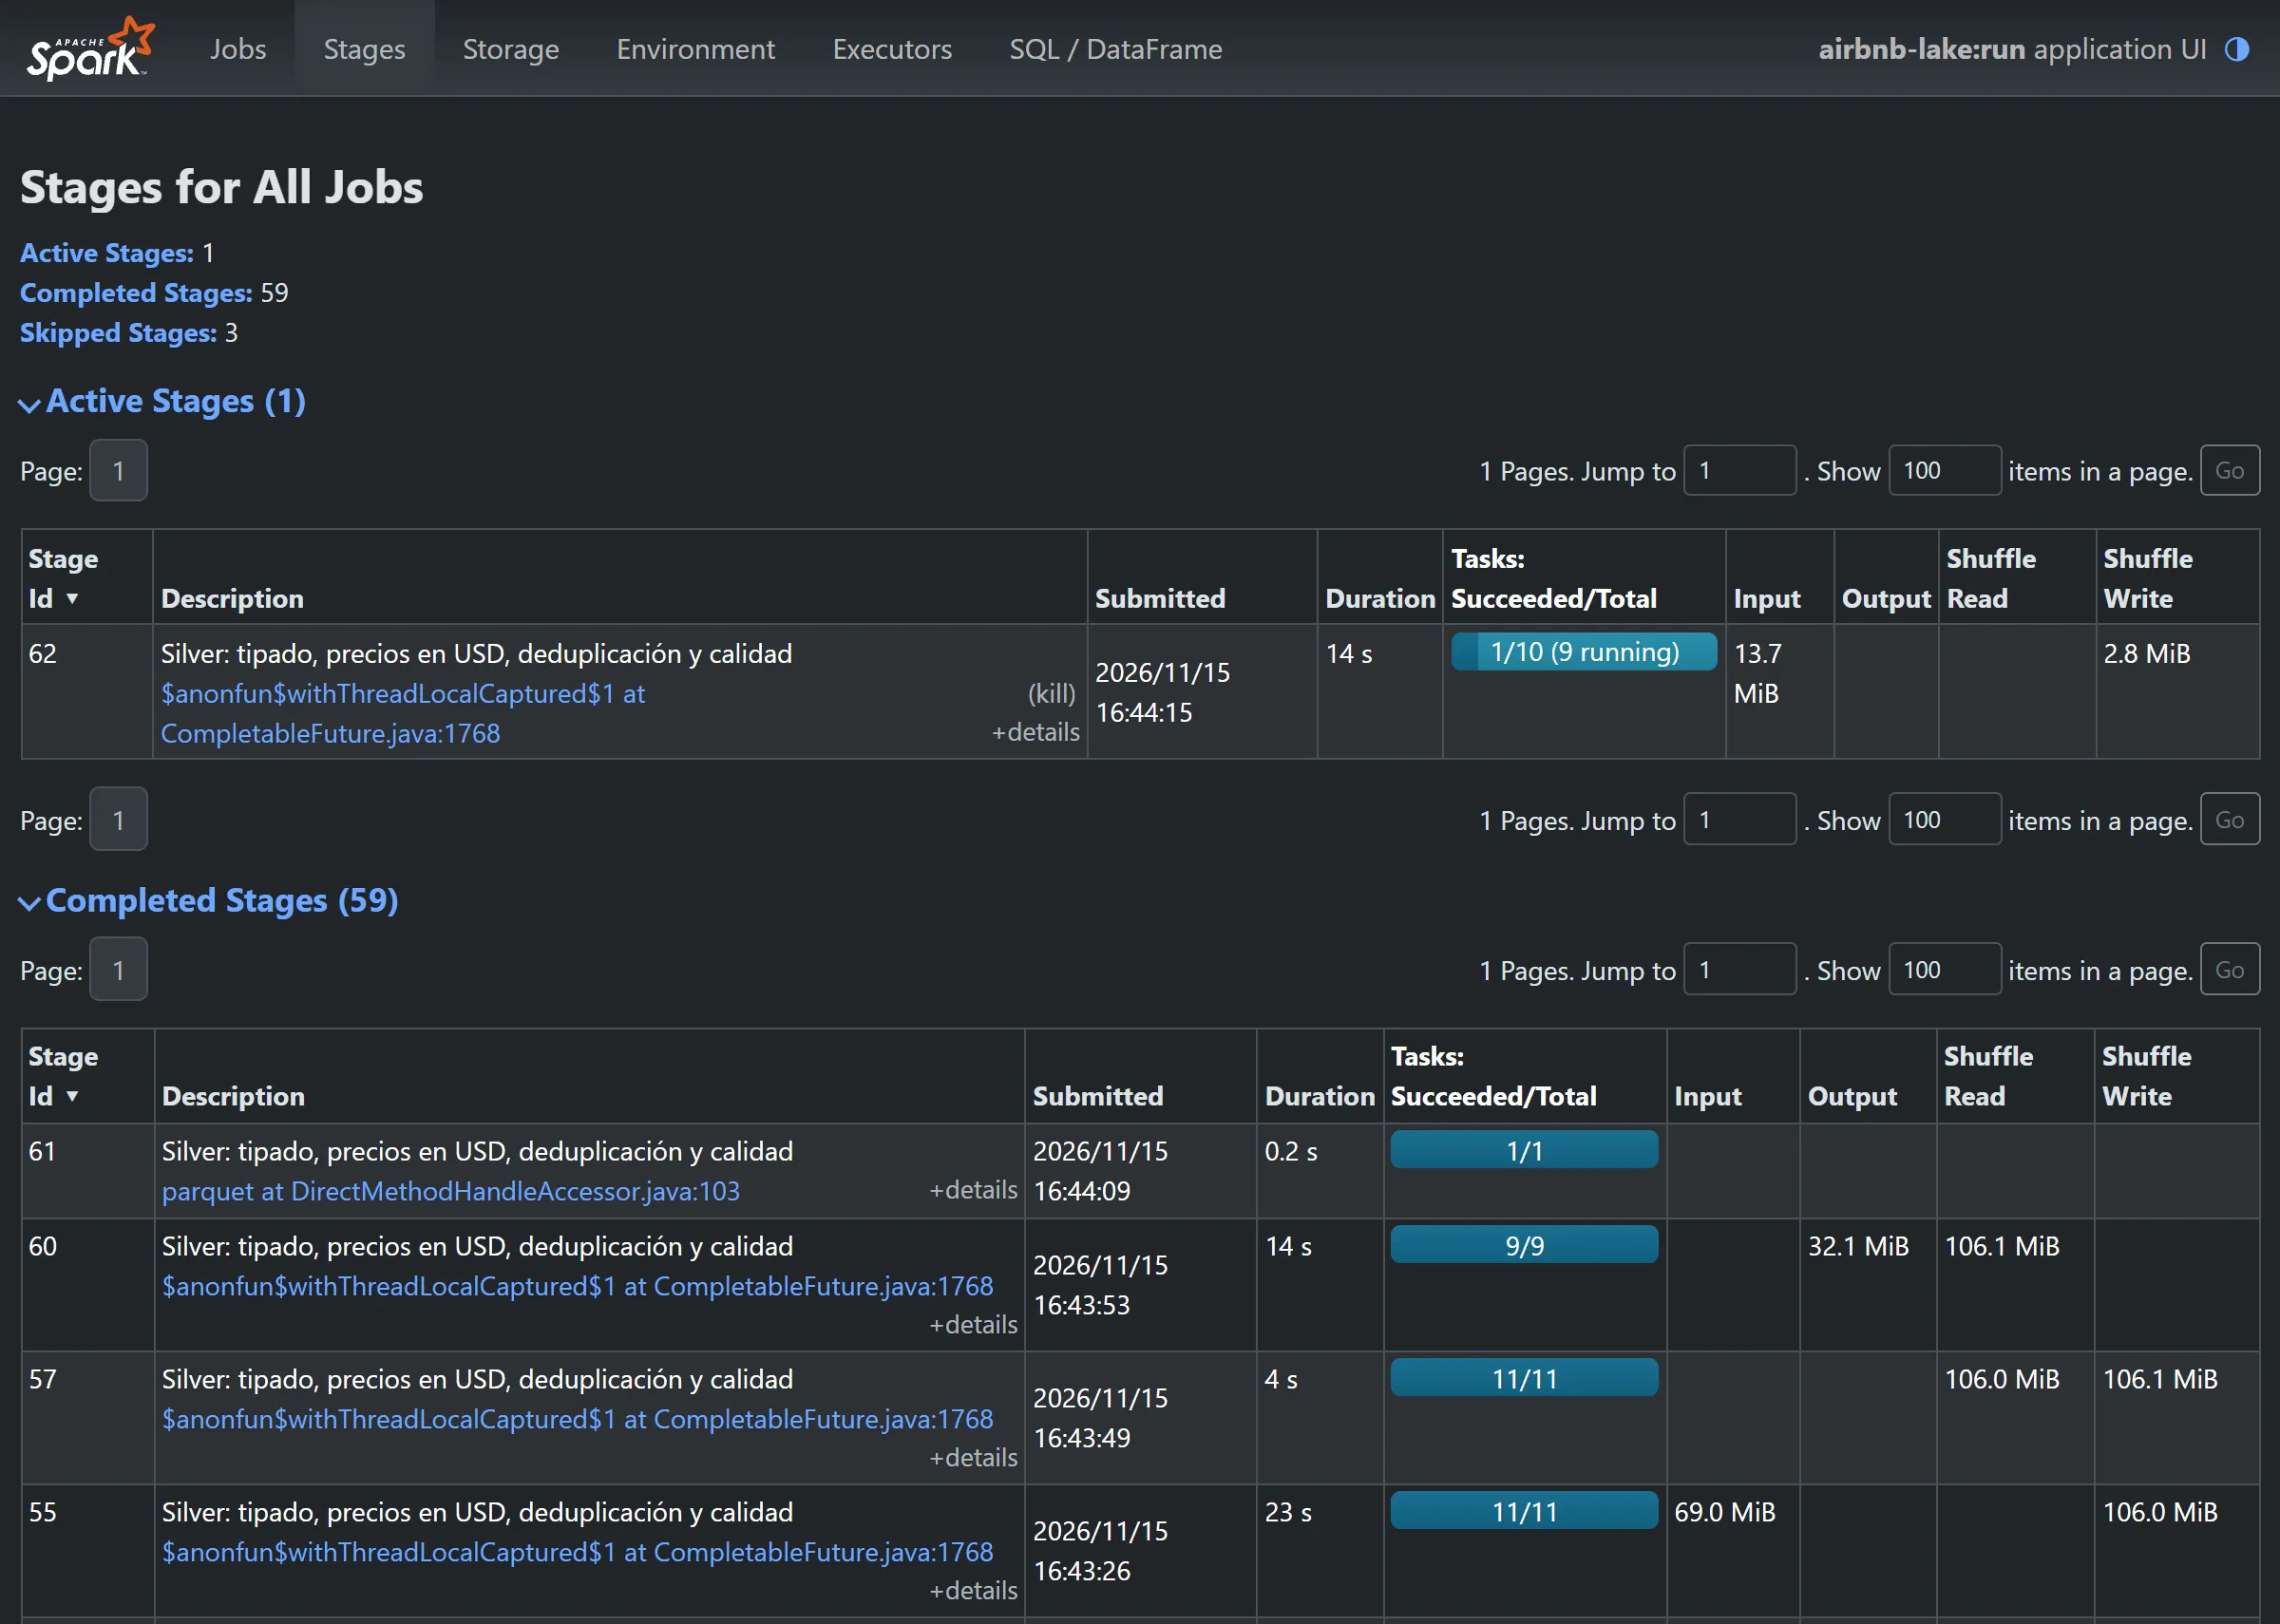
In silver the shuffles of the deduplication show up, with their read and write columns:
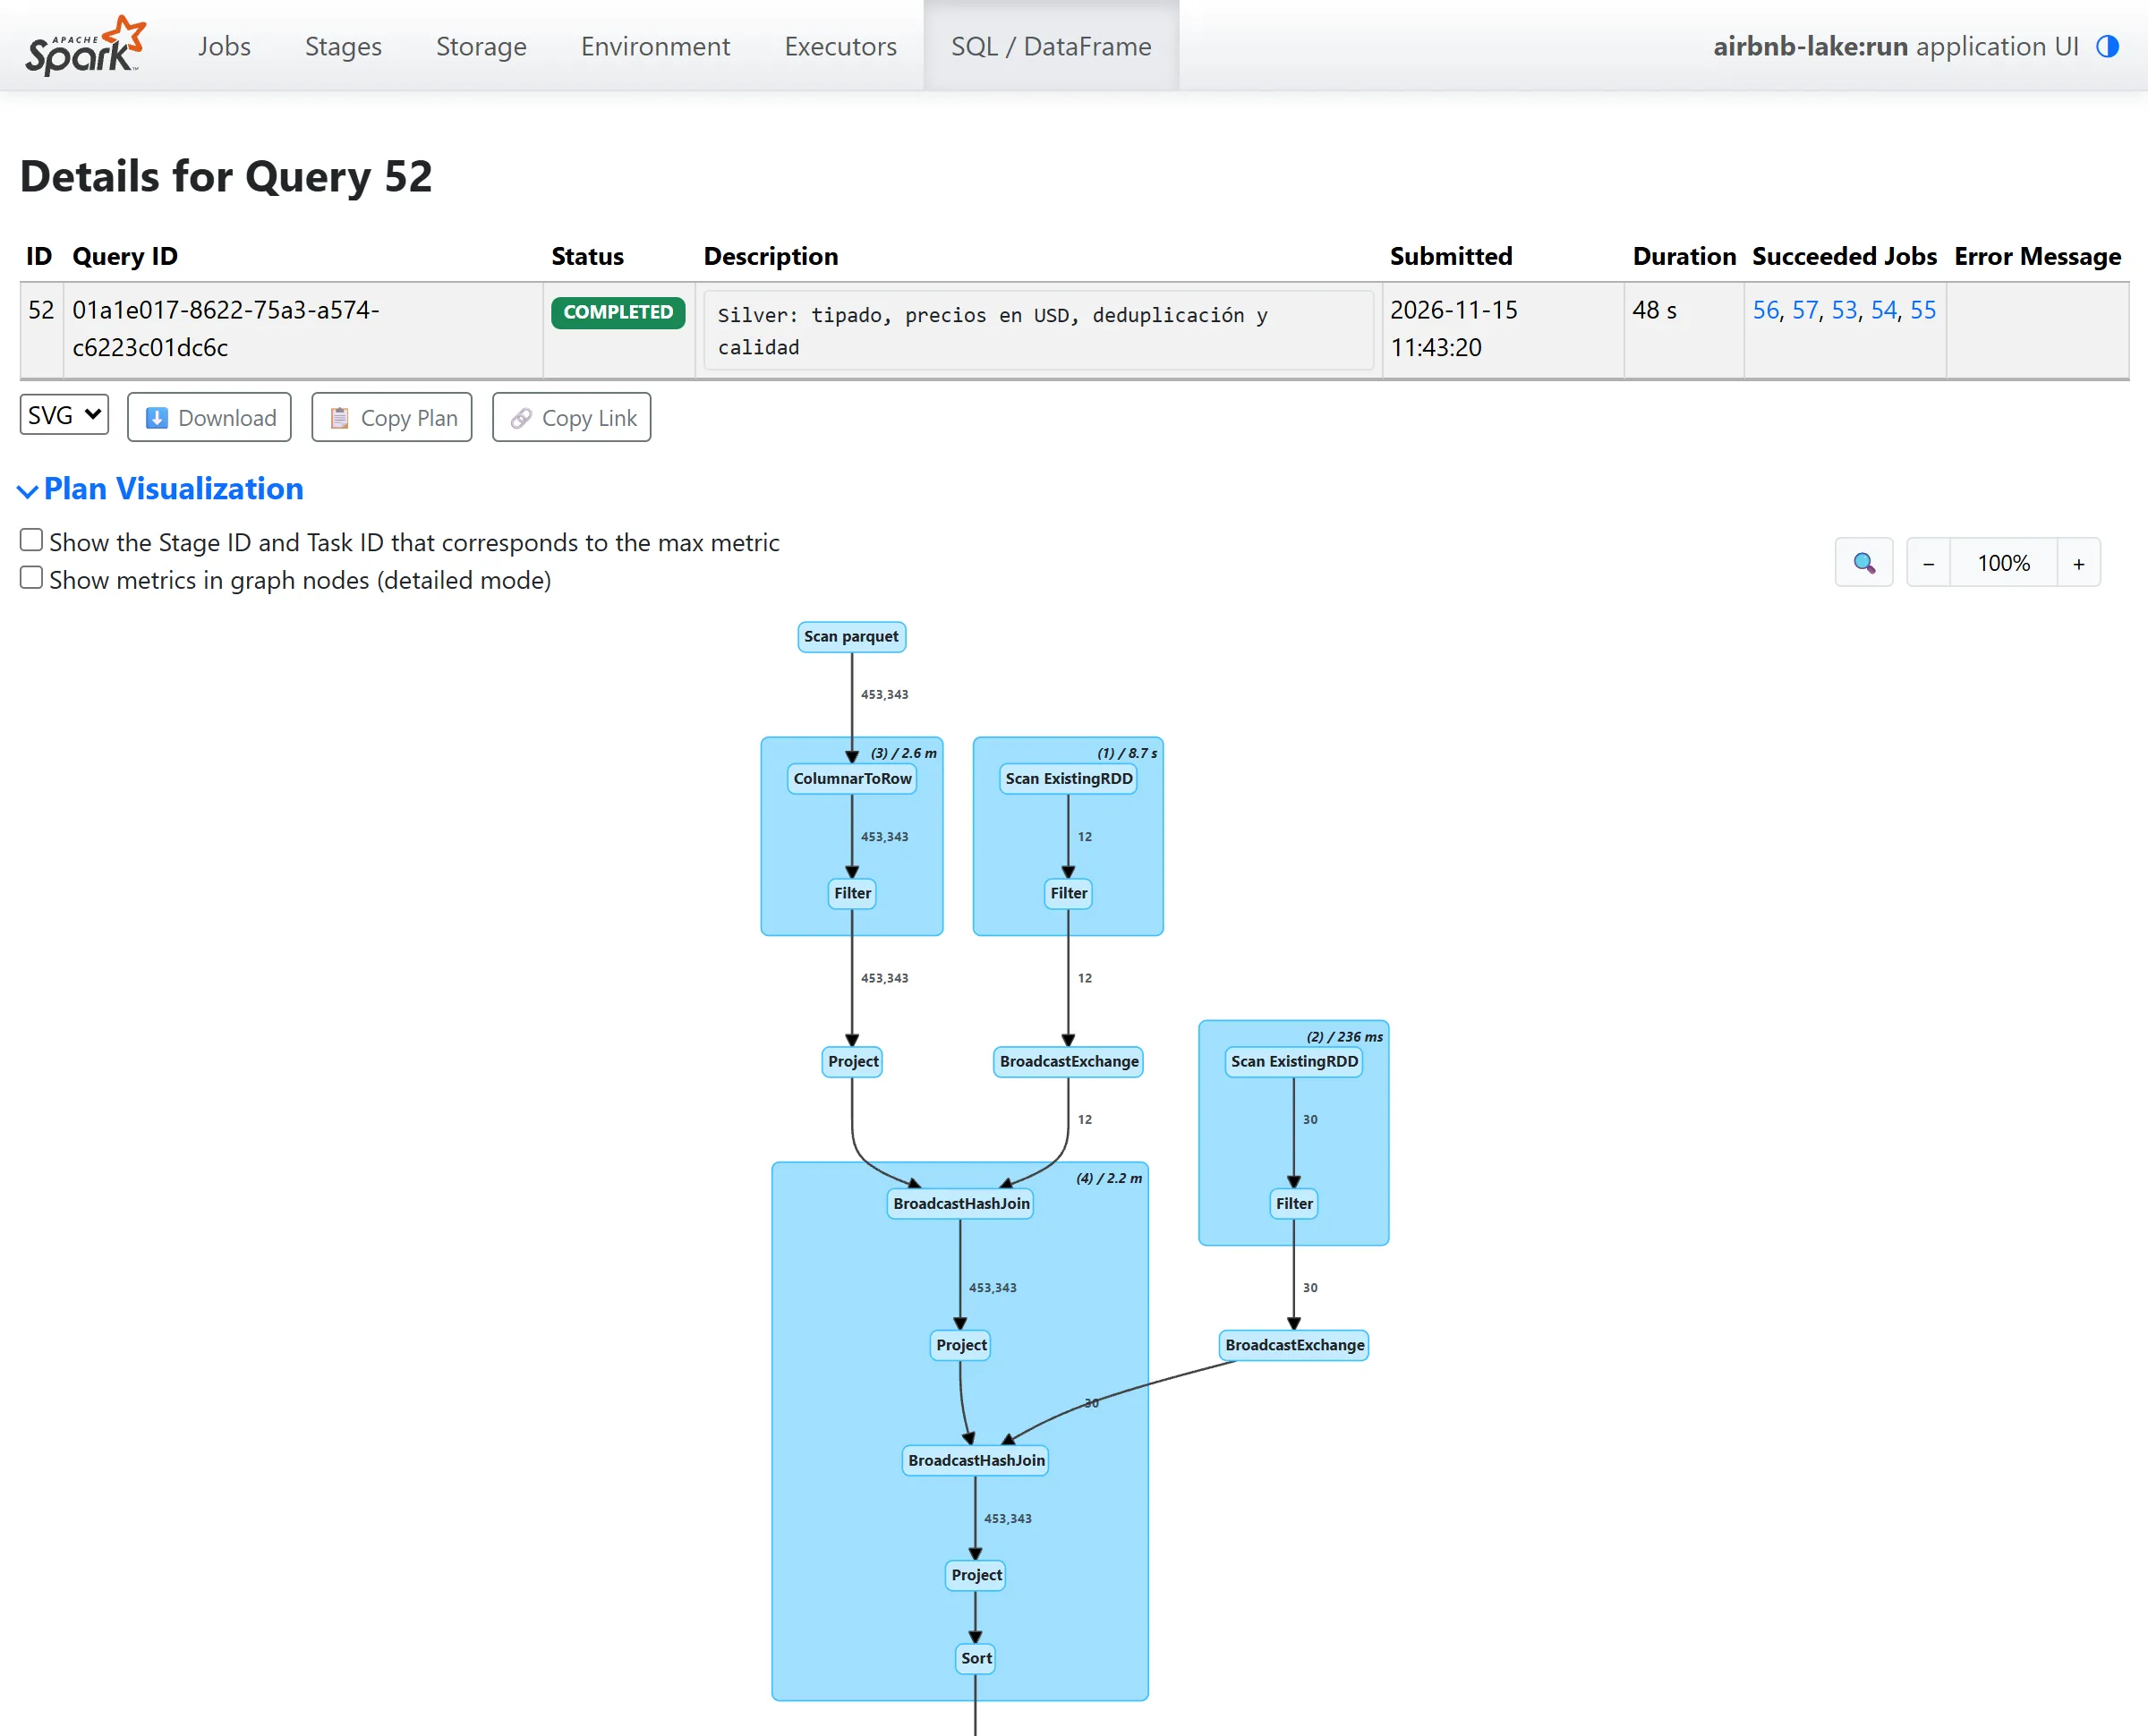
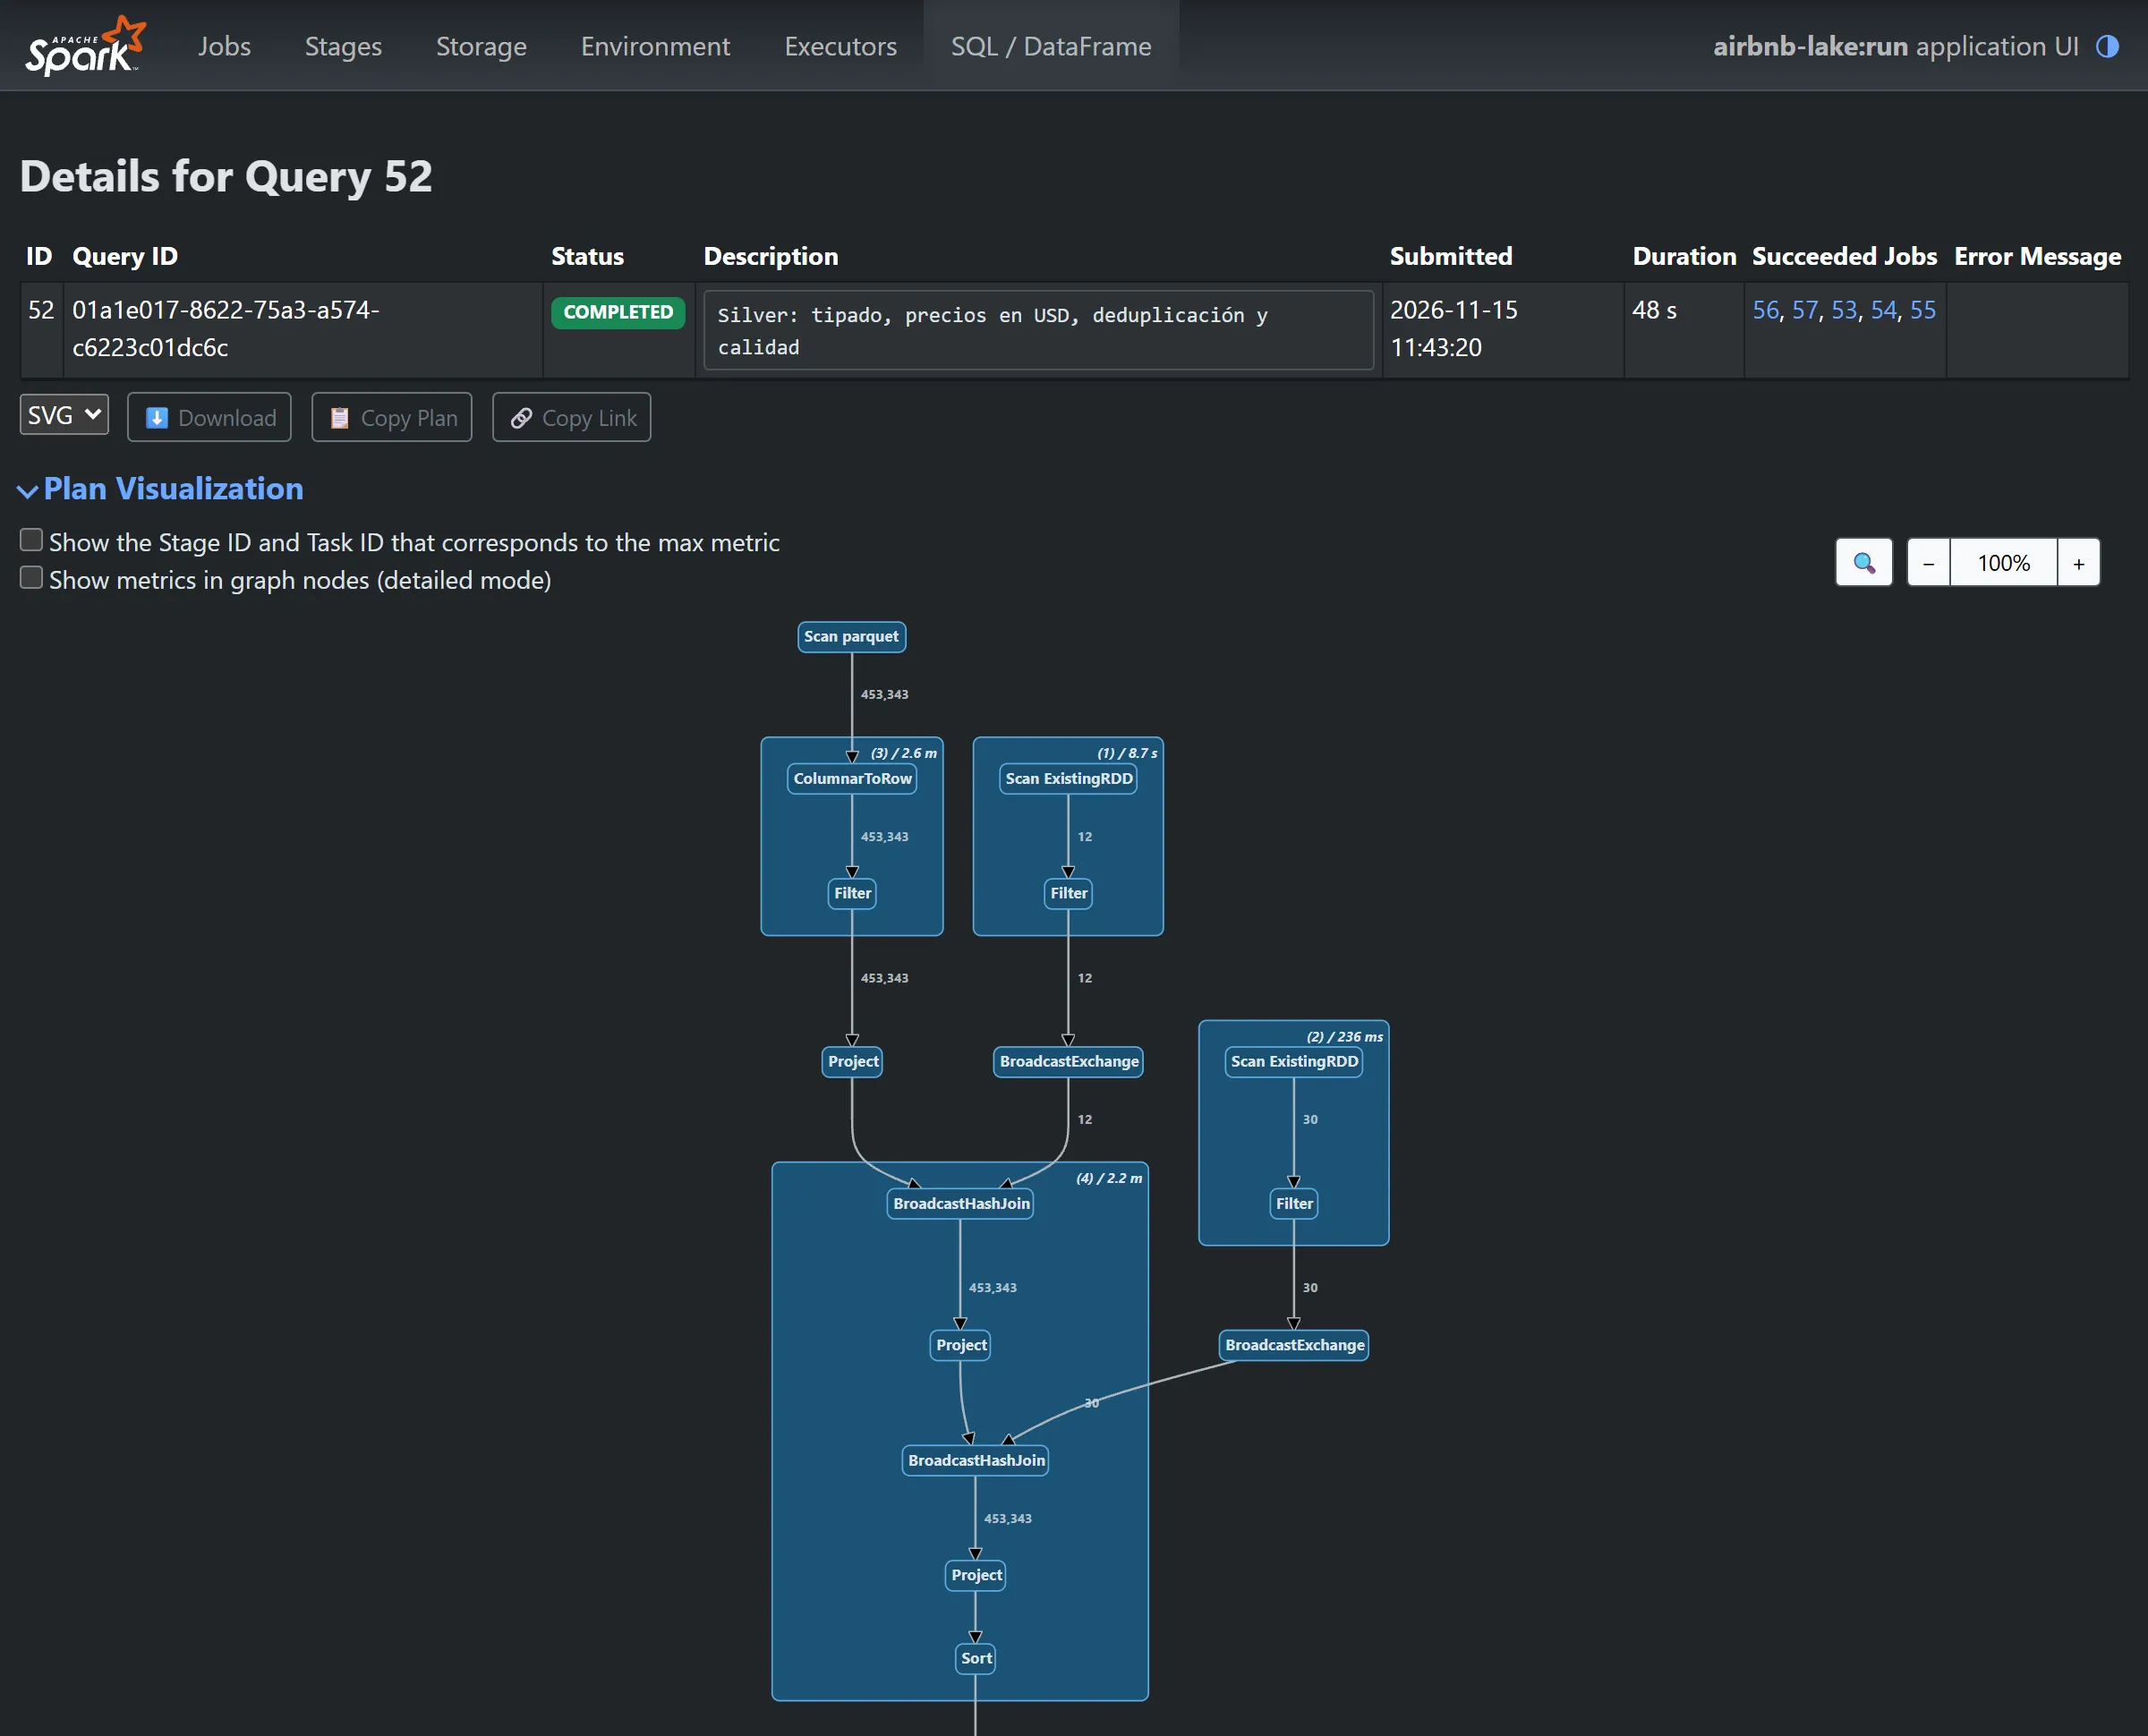
The plan of the listings query starts with the read from Bronze and two broadcast joins against two small tables, cities and exchange rates. Further down, outside the capture, come the windows that remove duplicates and the write:
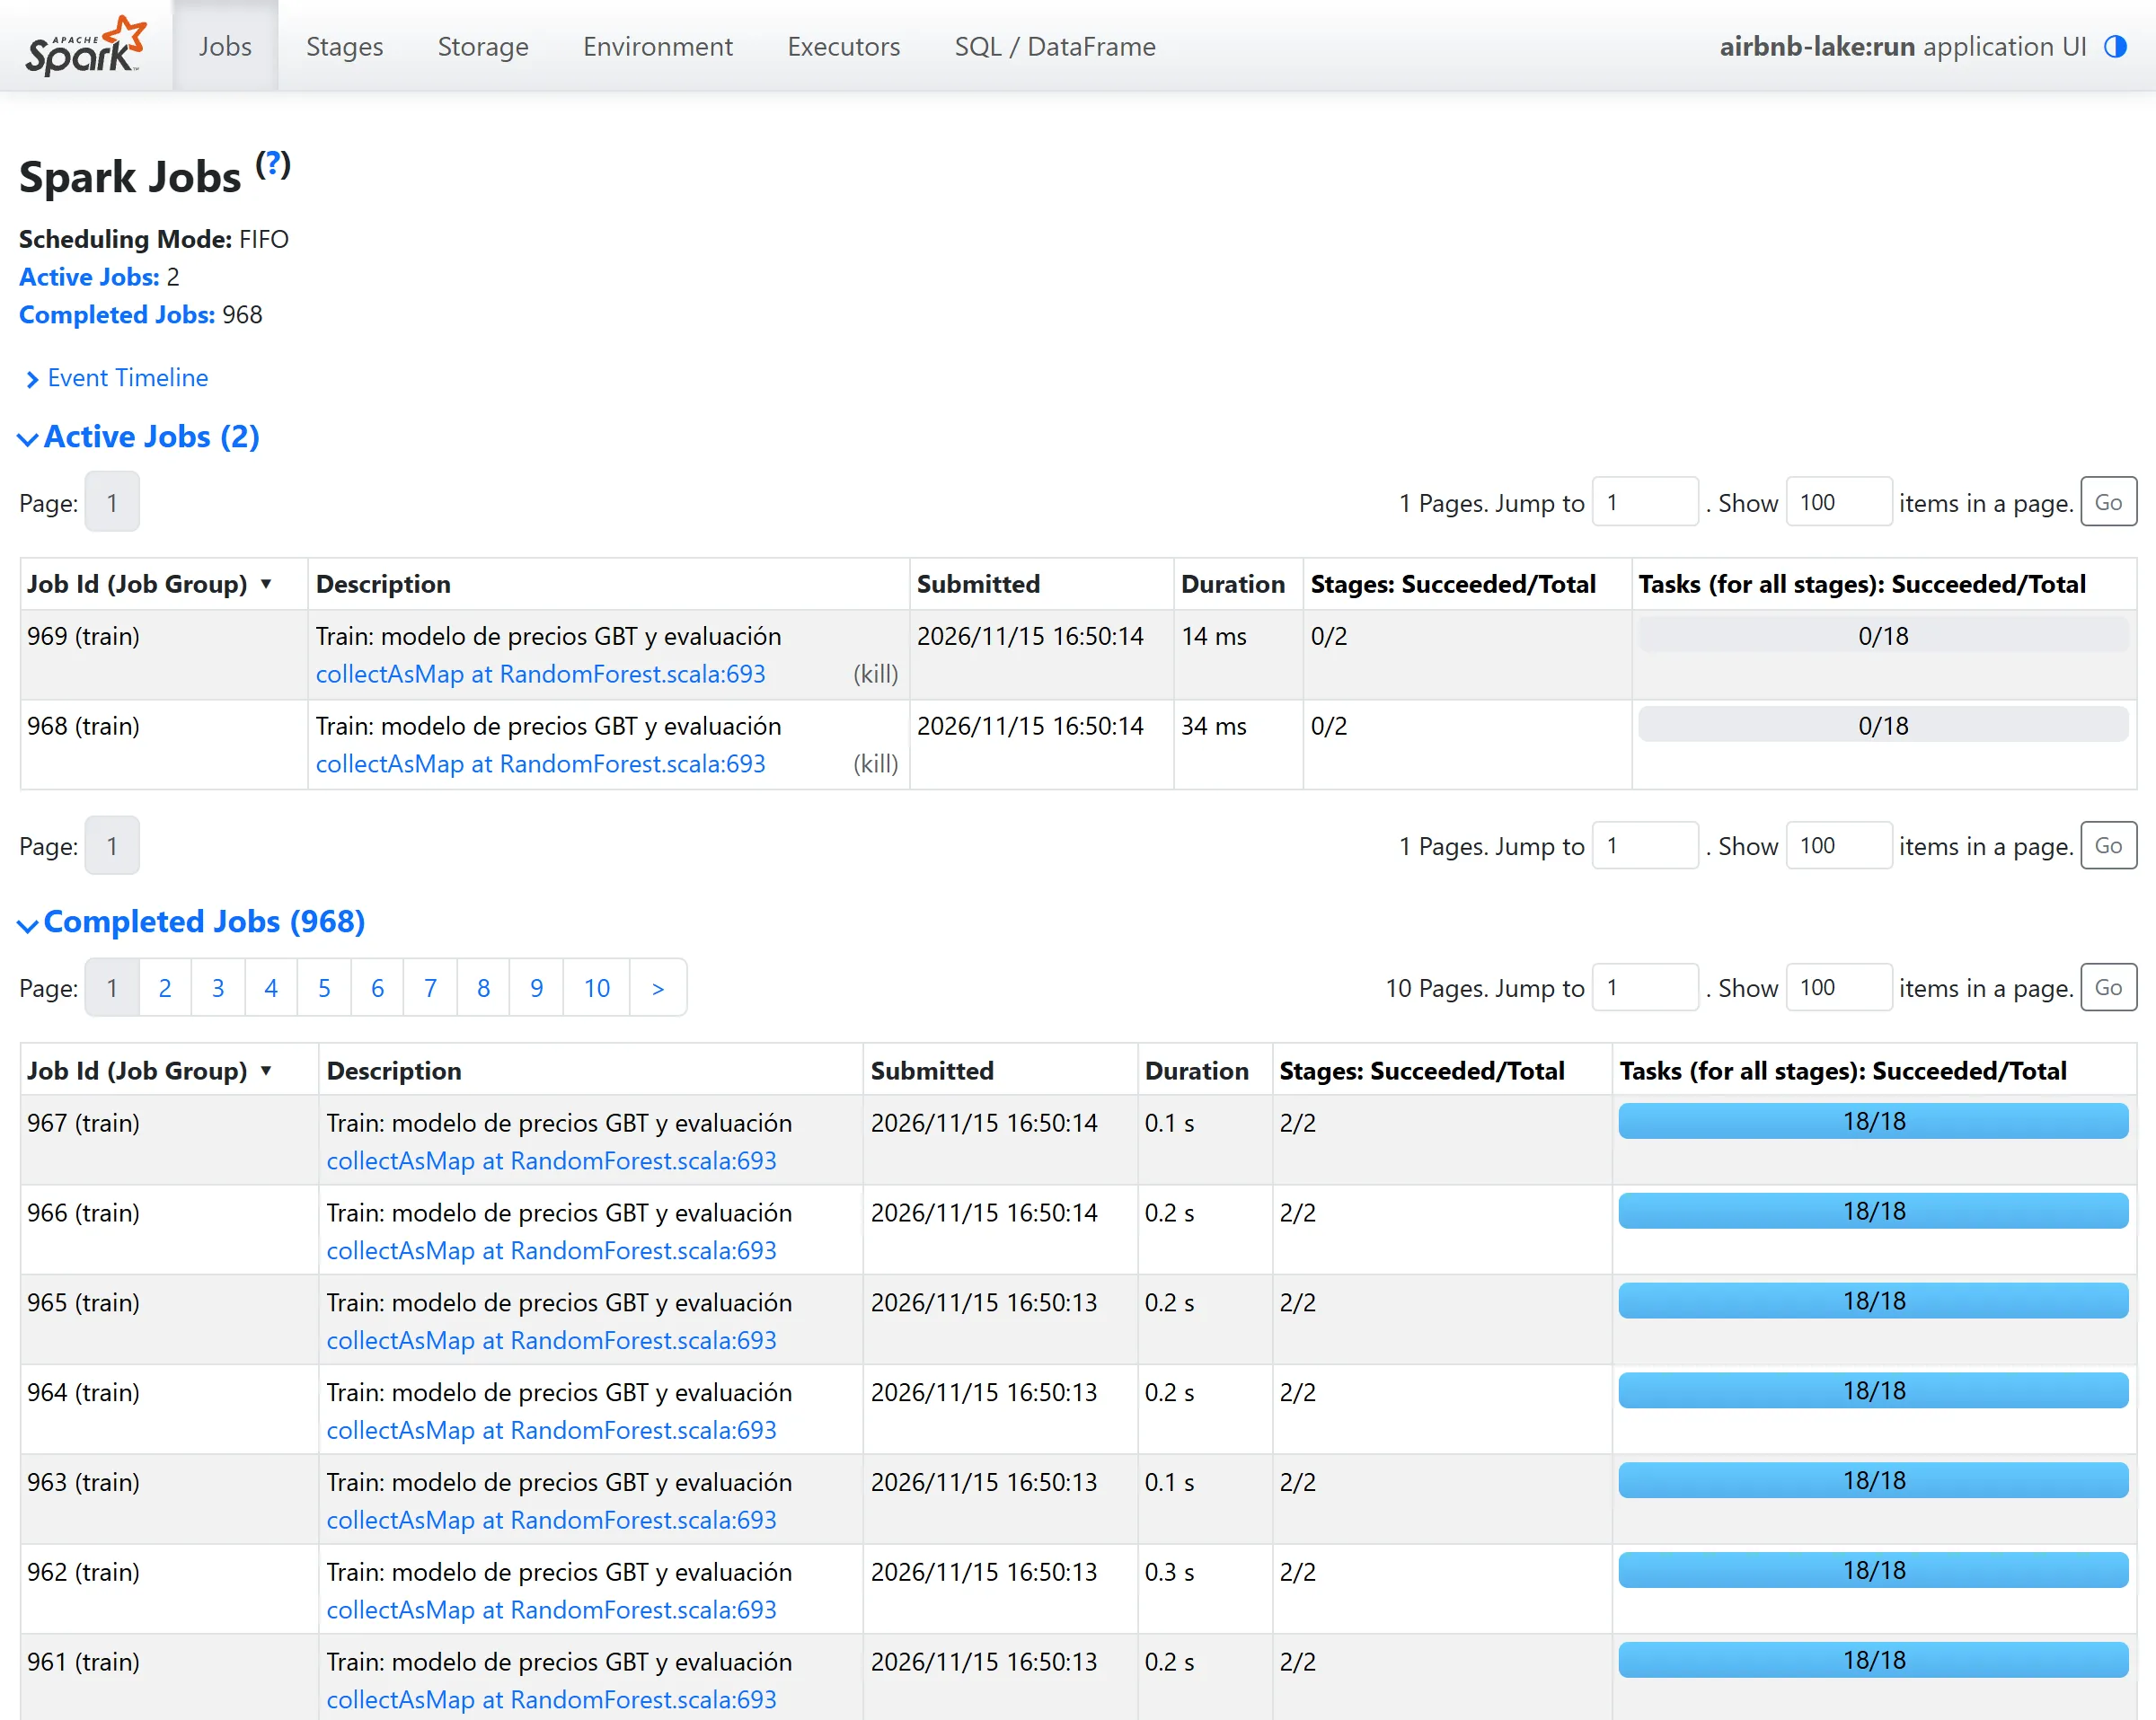
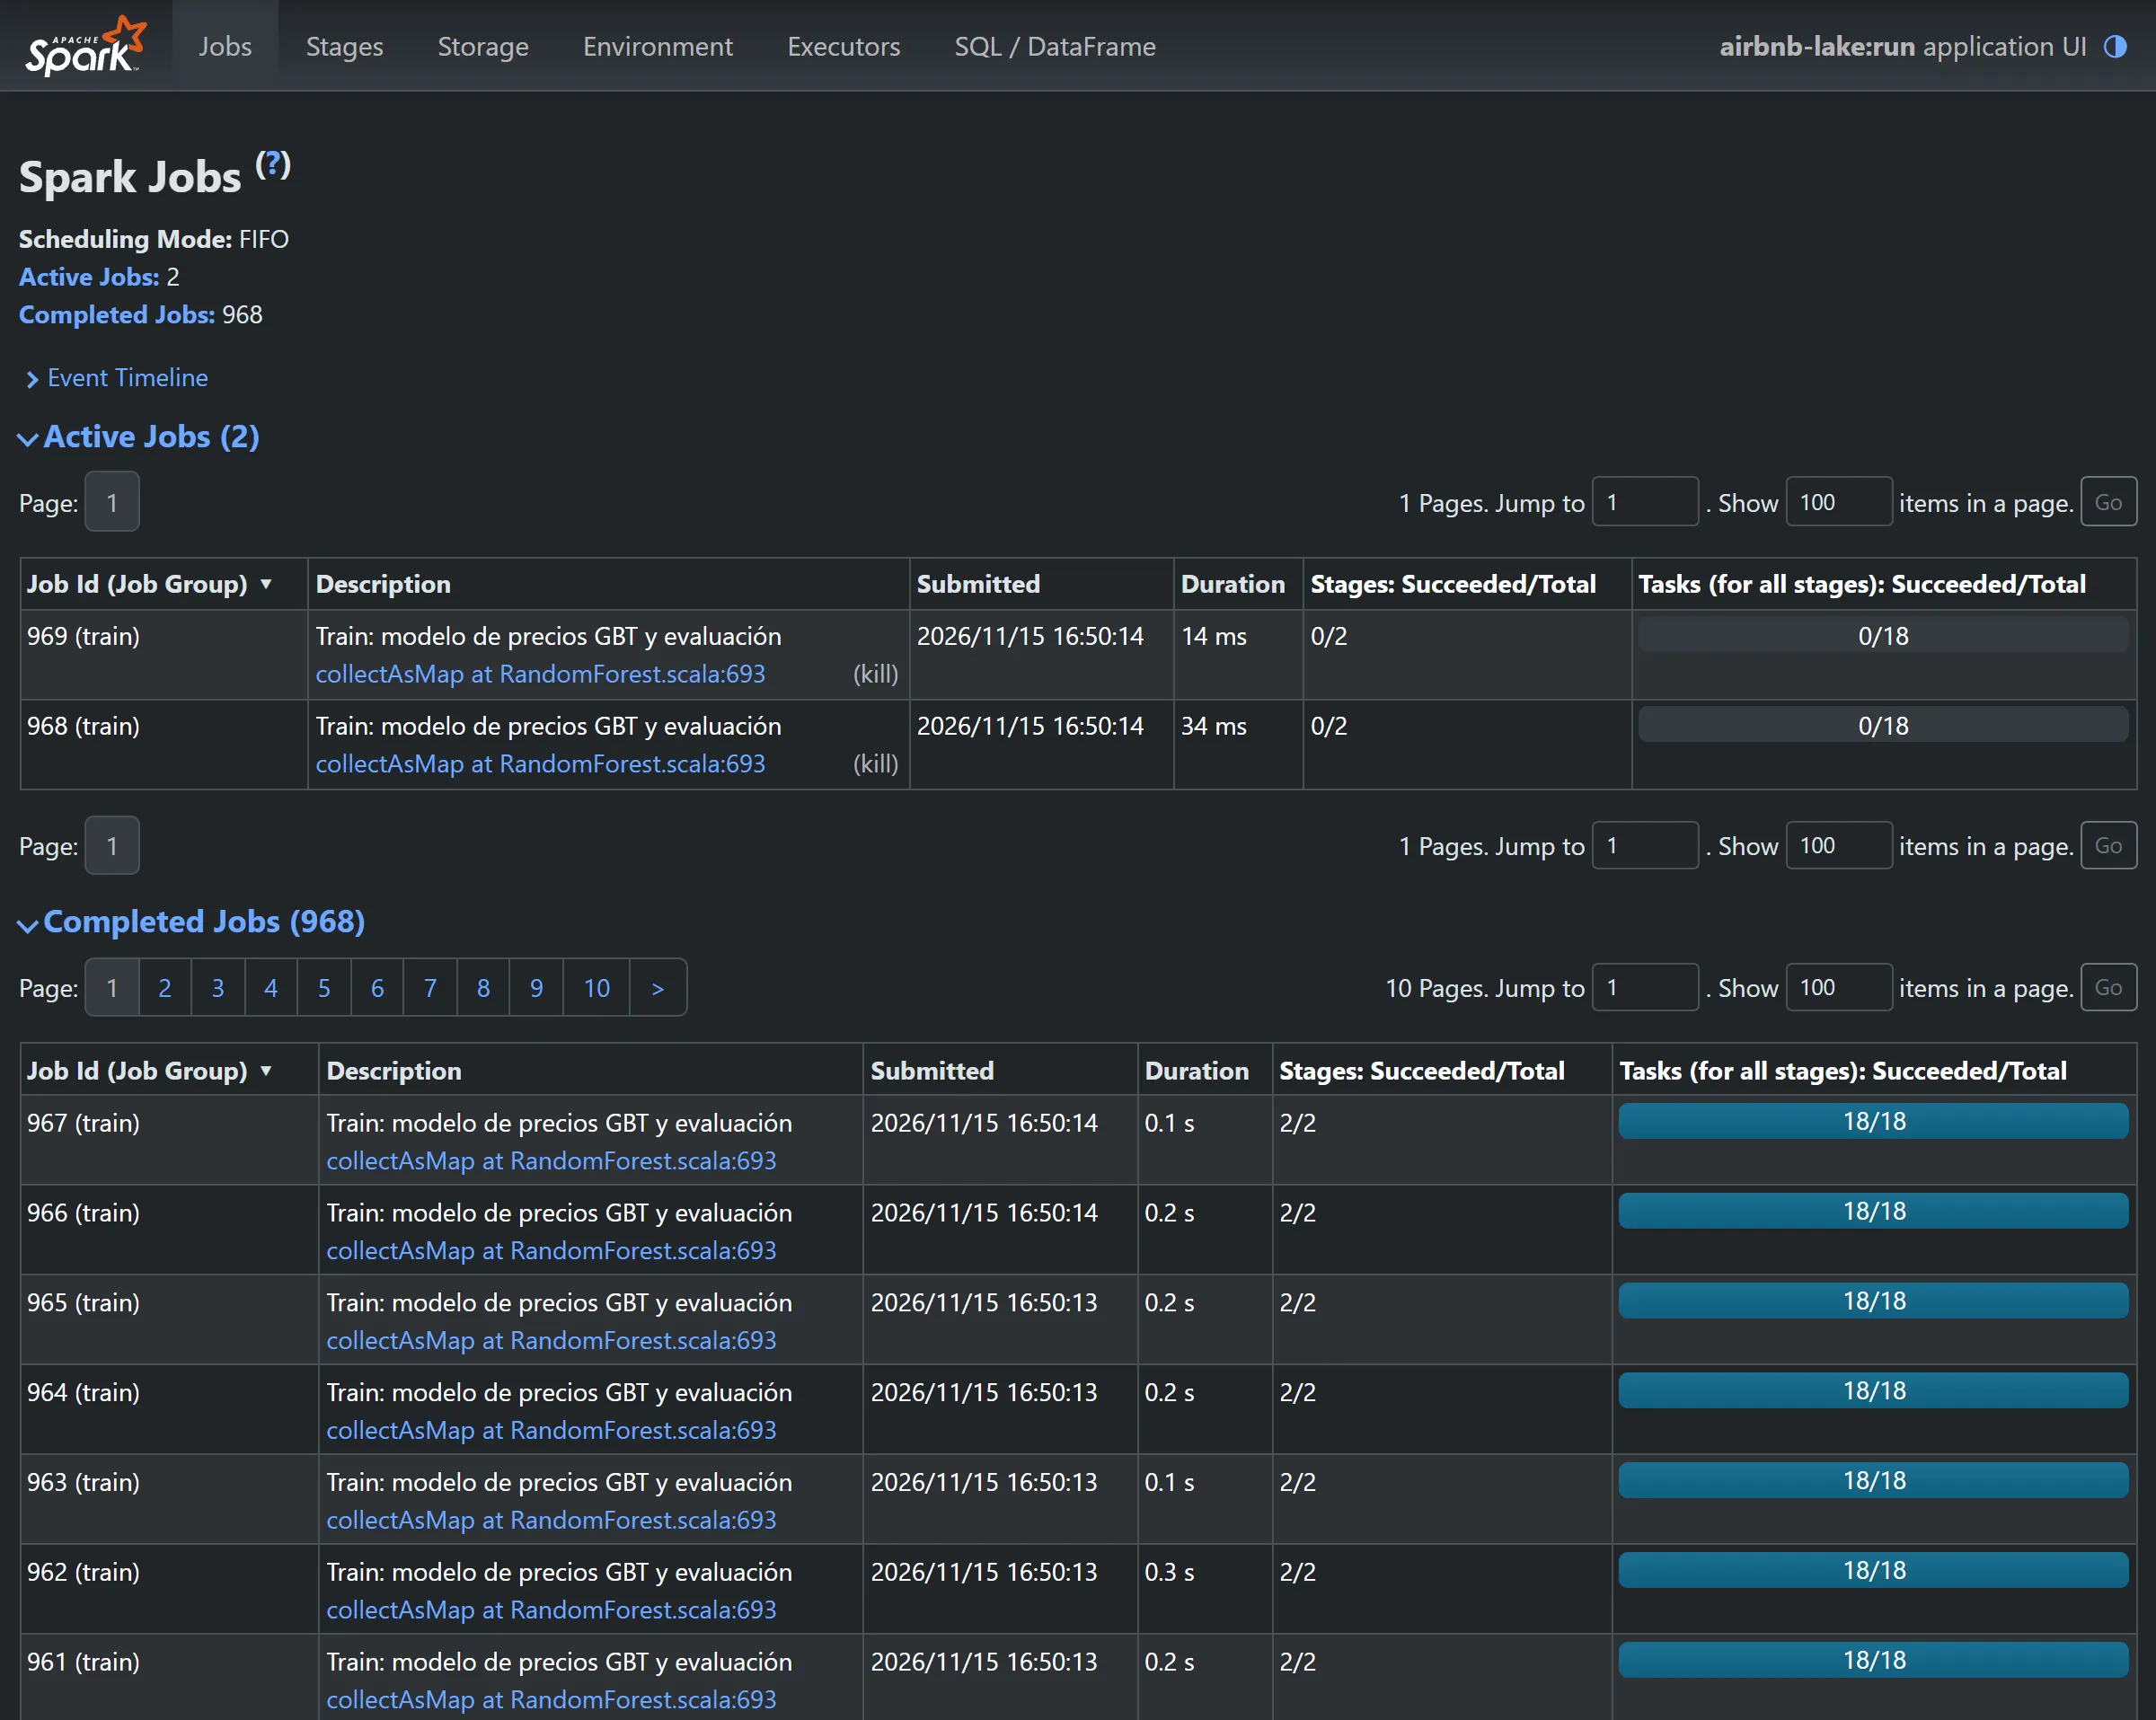
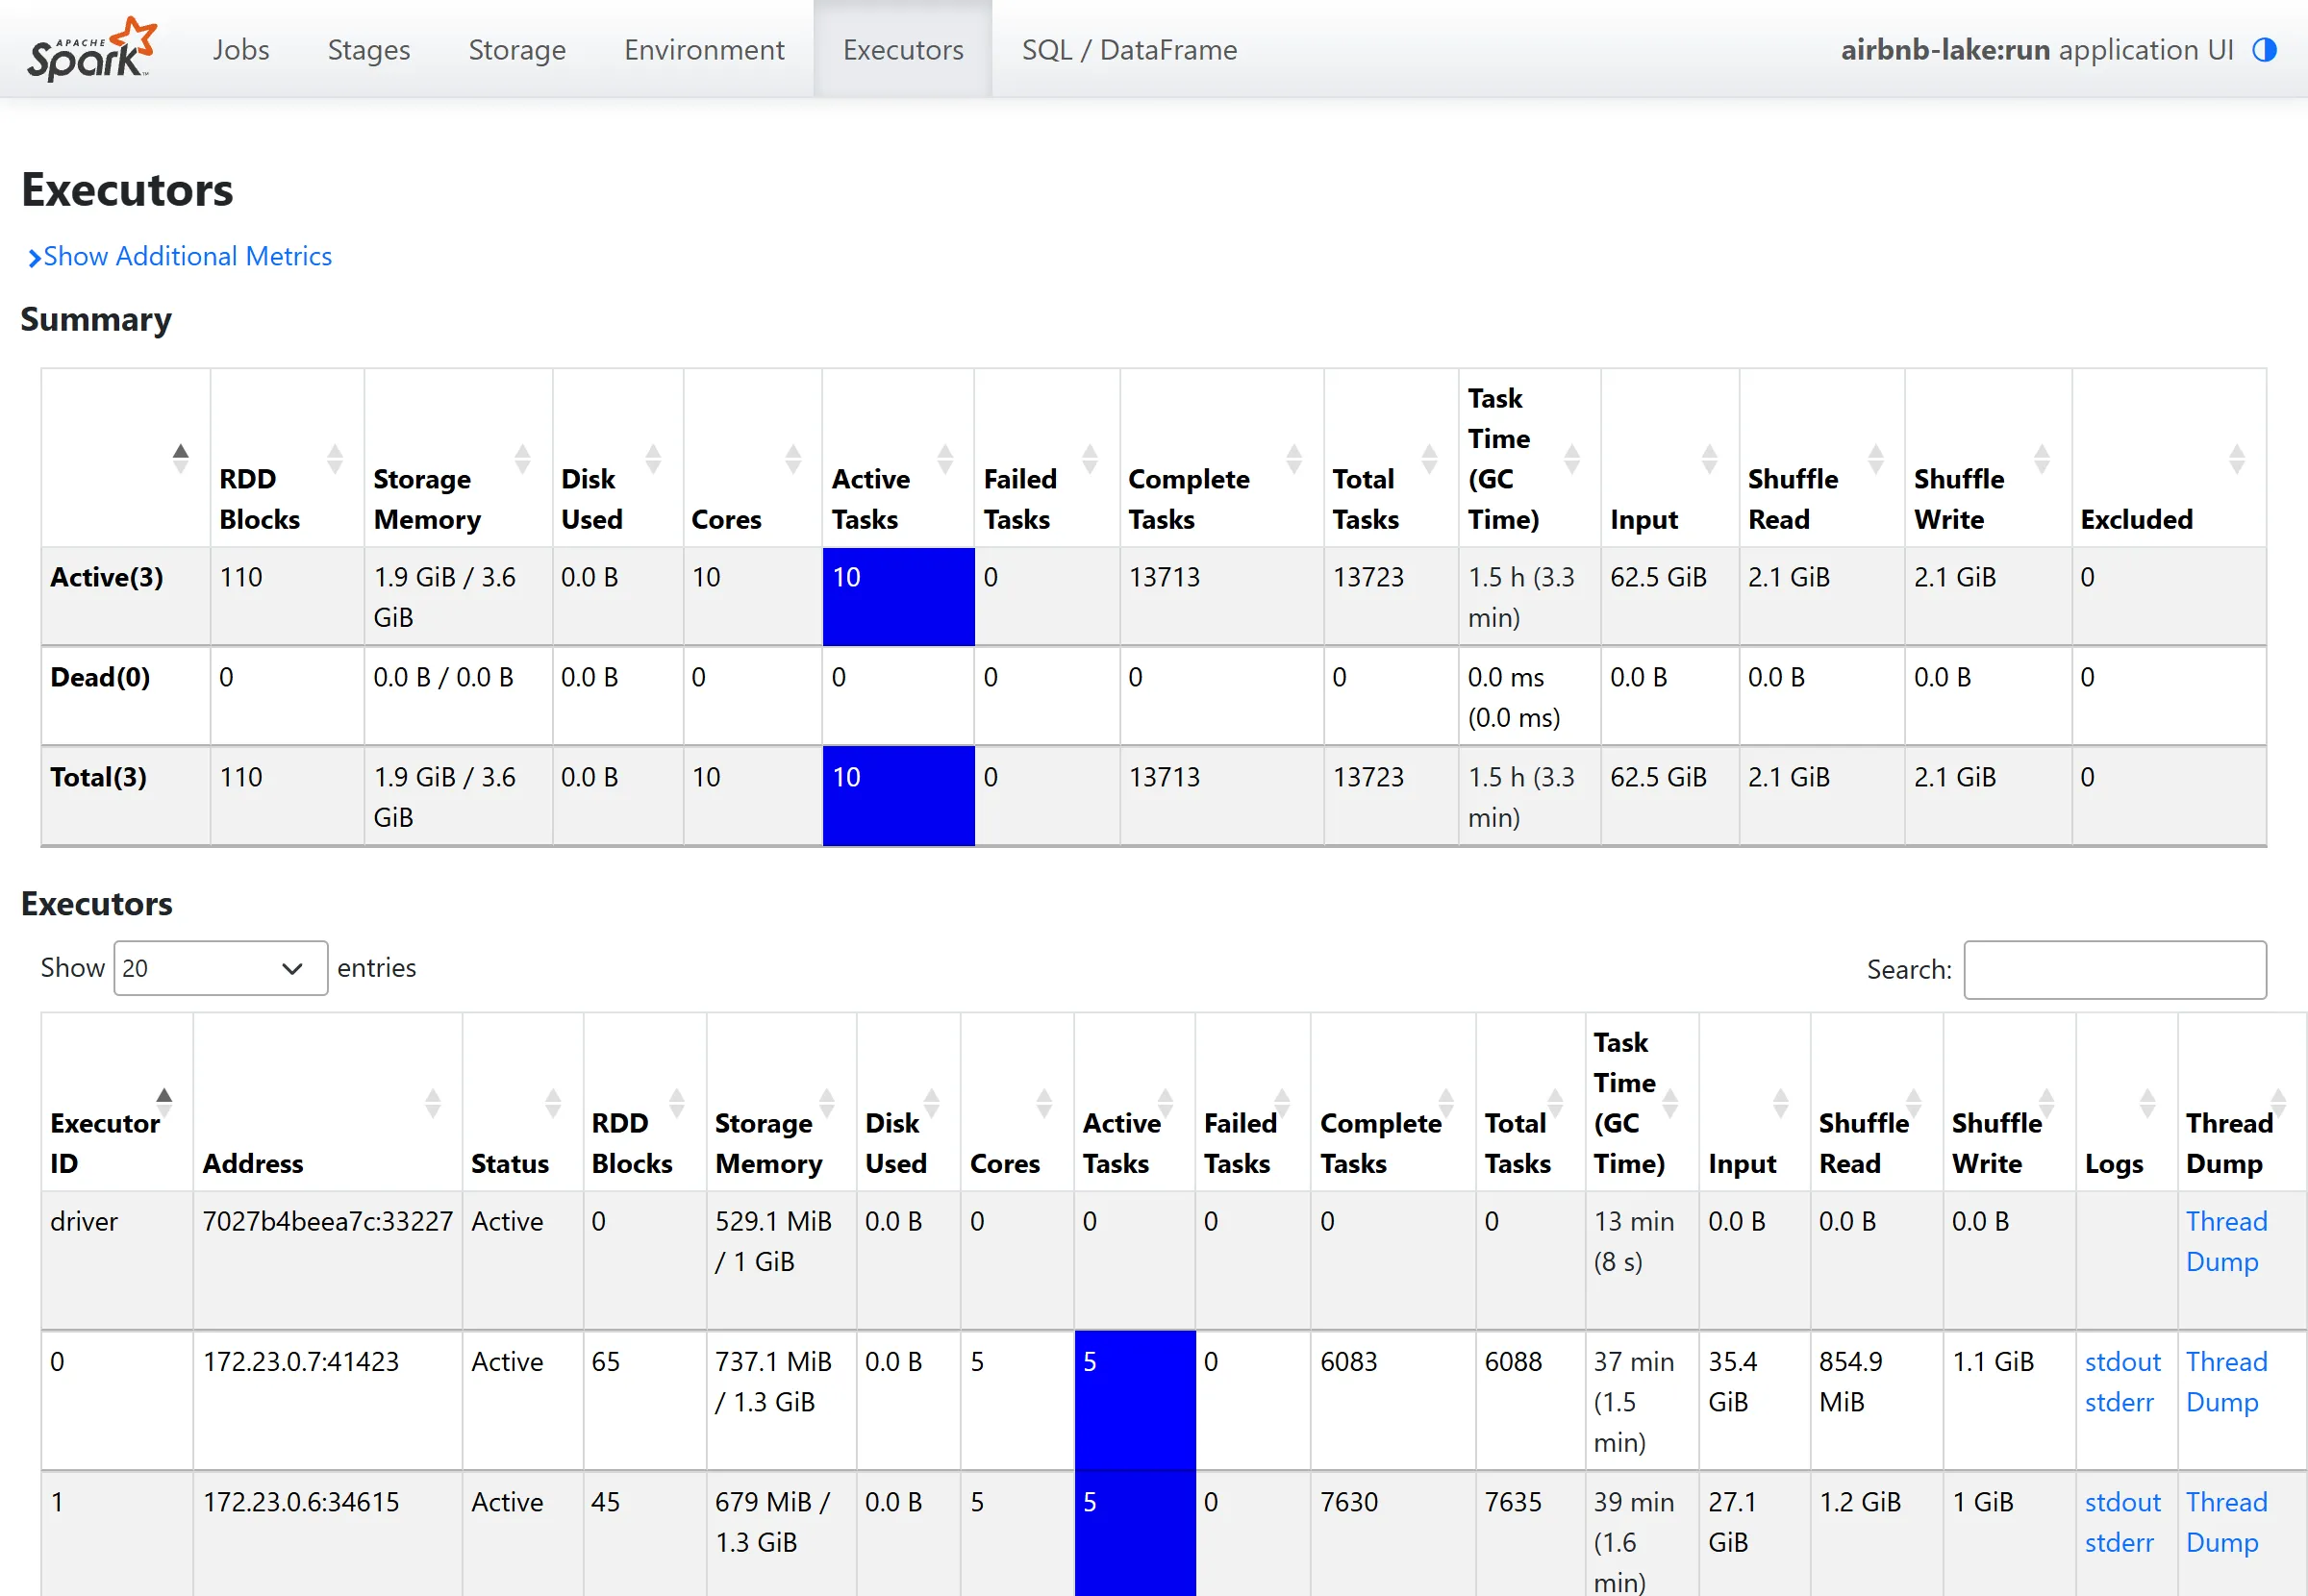
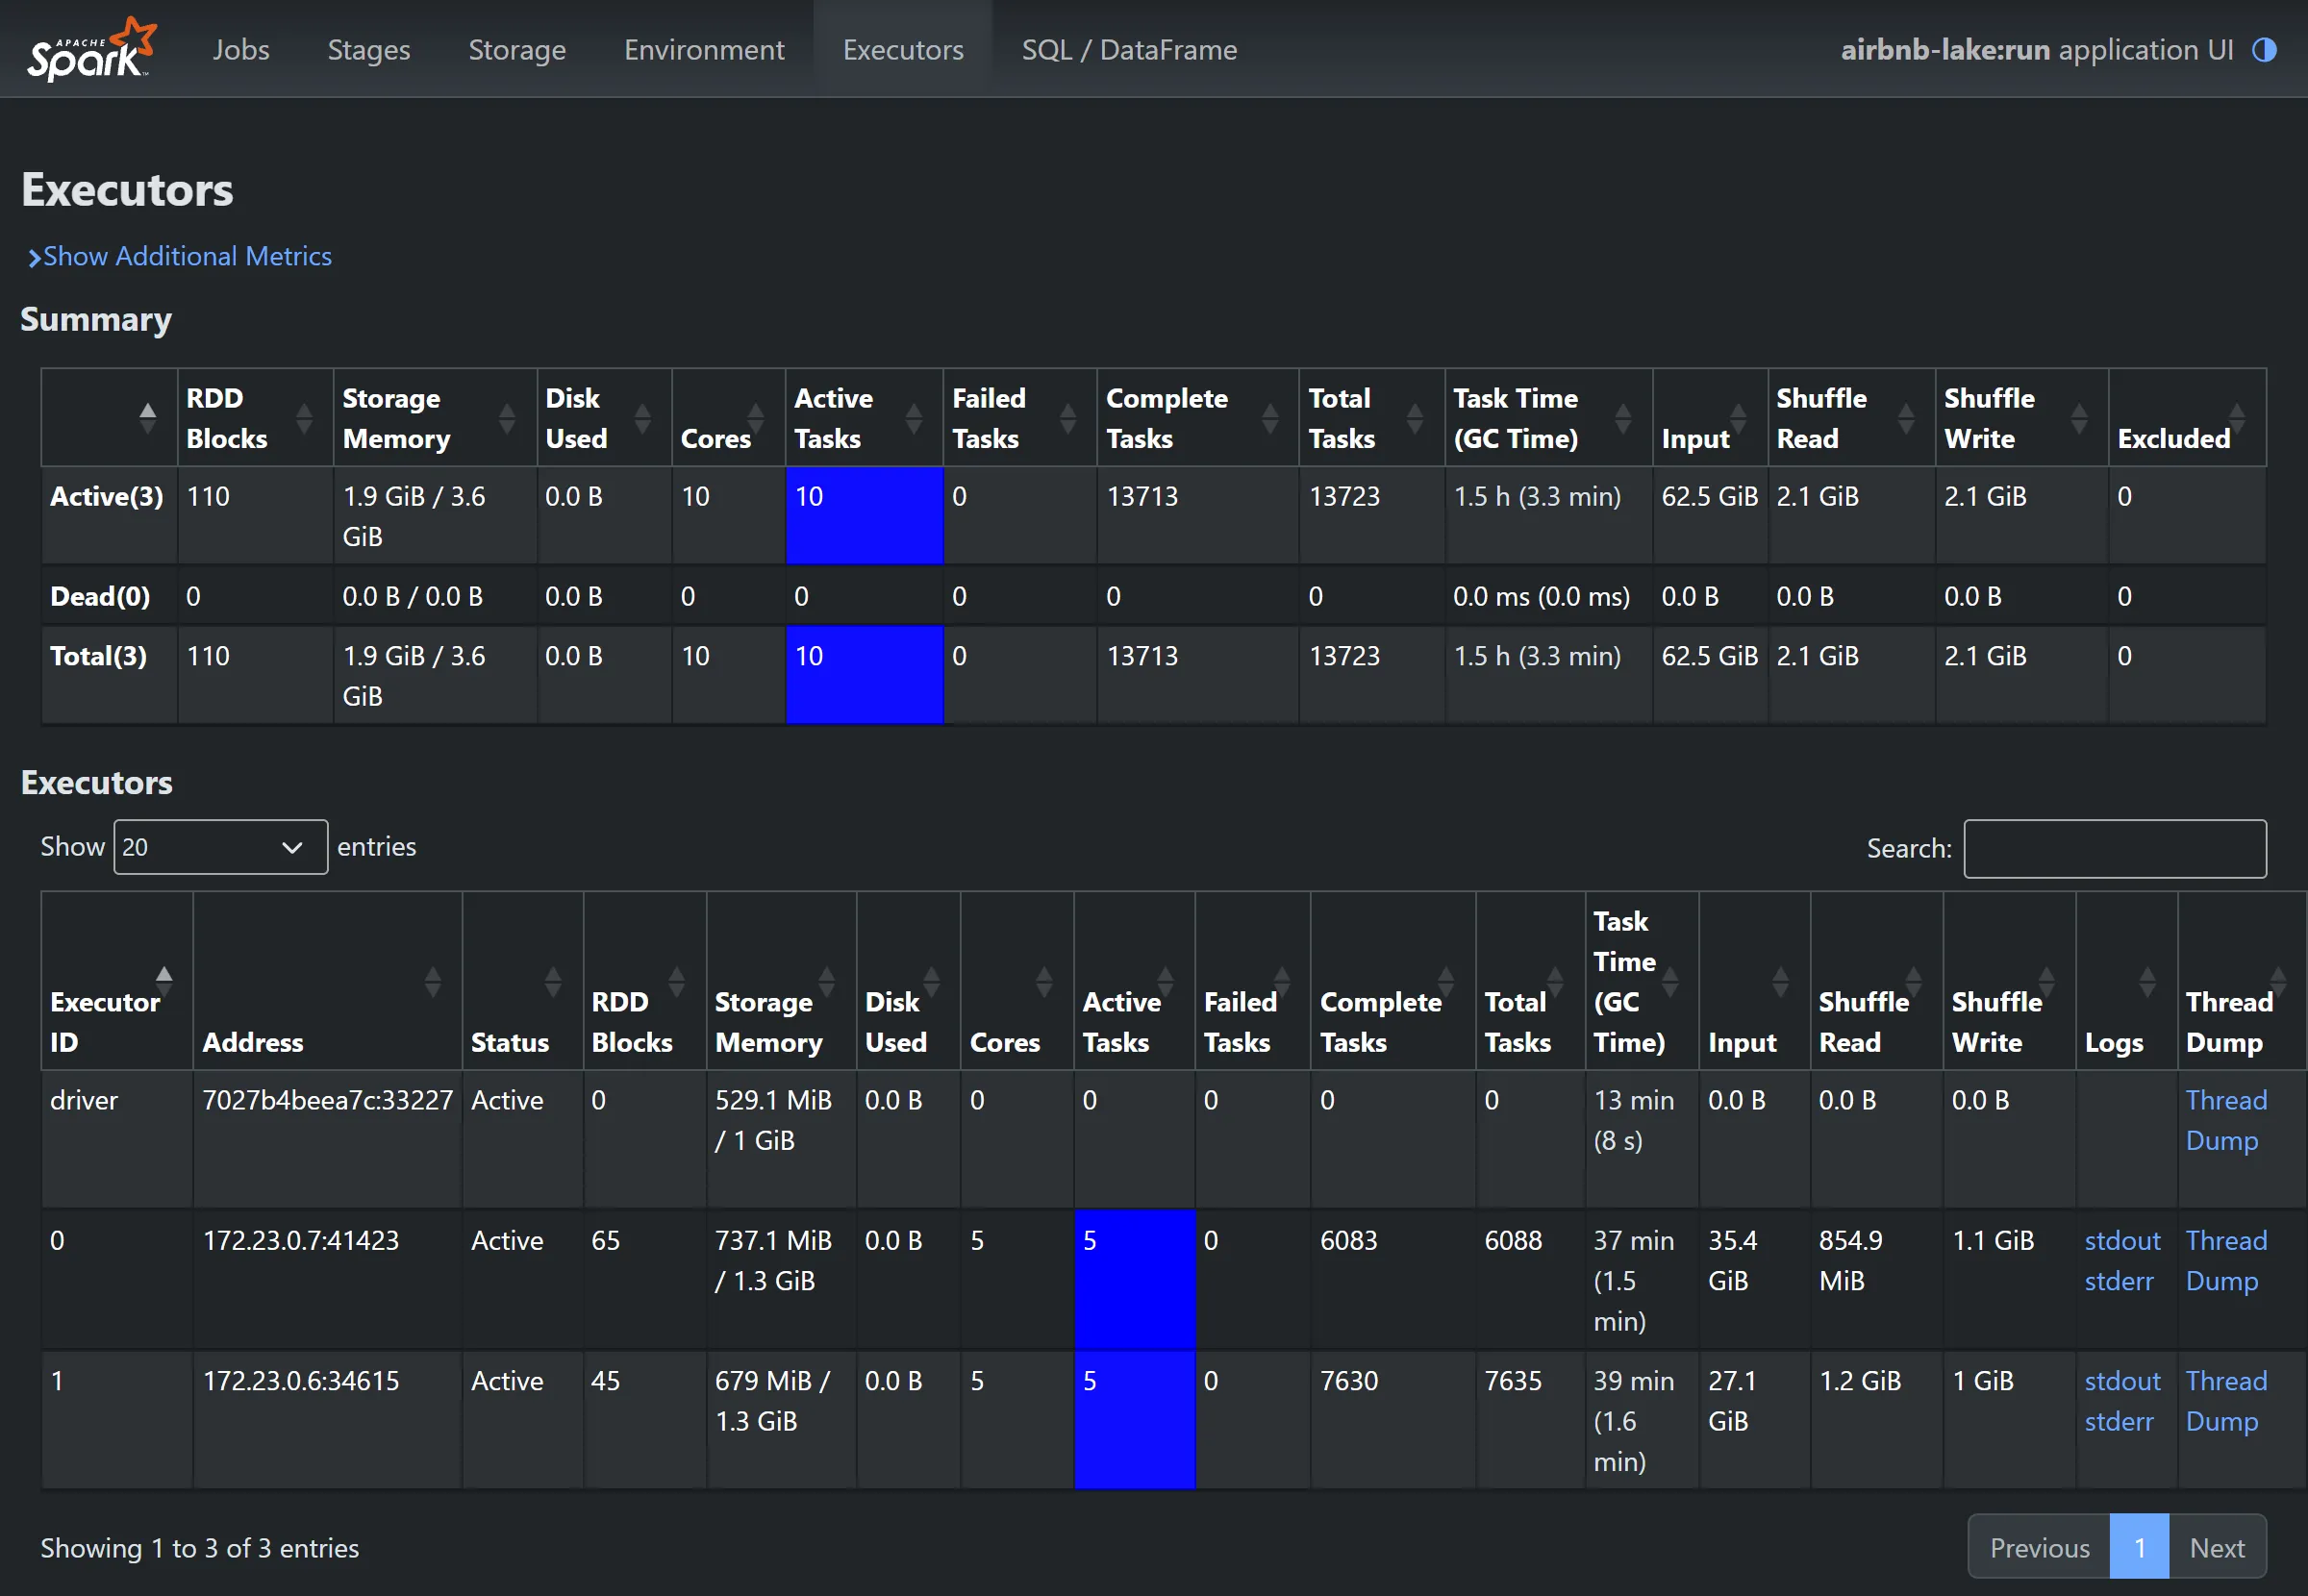
In train, fitting the model launches hundreds of short jobs, 937 in this run, with the ten cores busy:
When it finishes, each zone of the lake takes this much on HDFS:
/lake/raw      2.7 GB   source files, compressed
/lake/bronze   2.0 GB   Parquet, all text
/lake/silver   349 MB   typed Parquet; calendar by listing and month
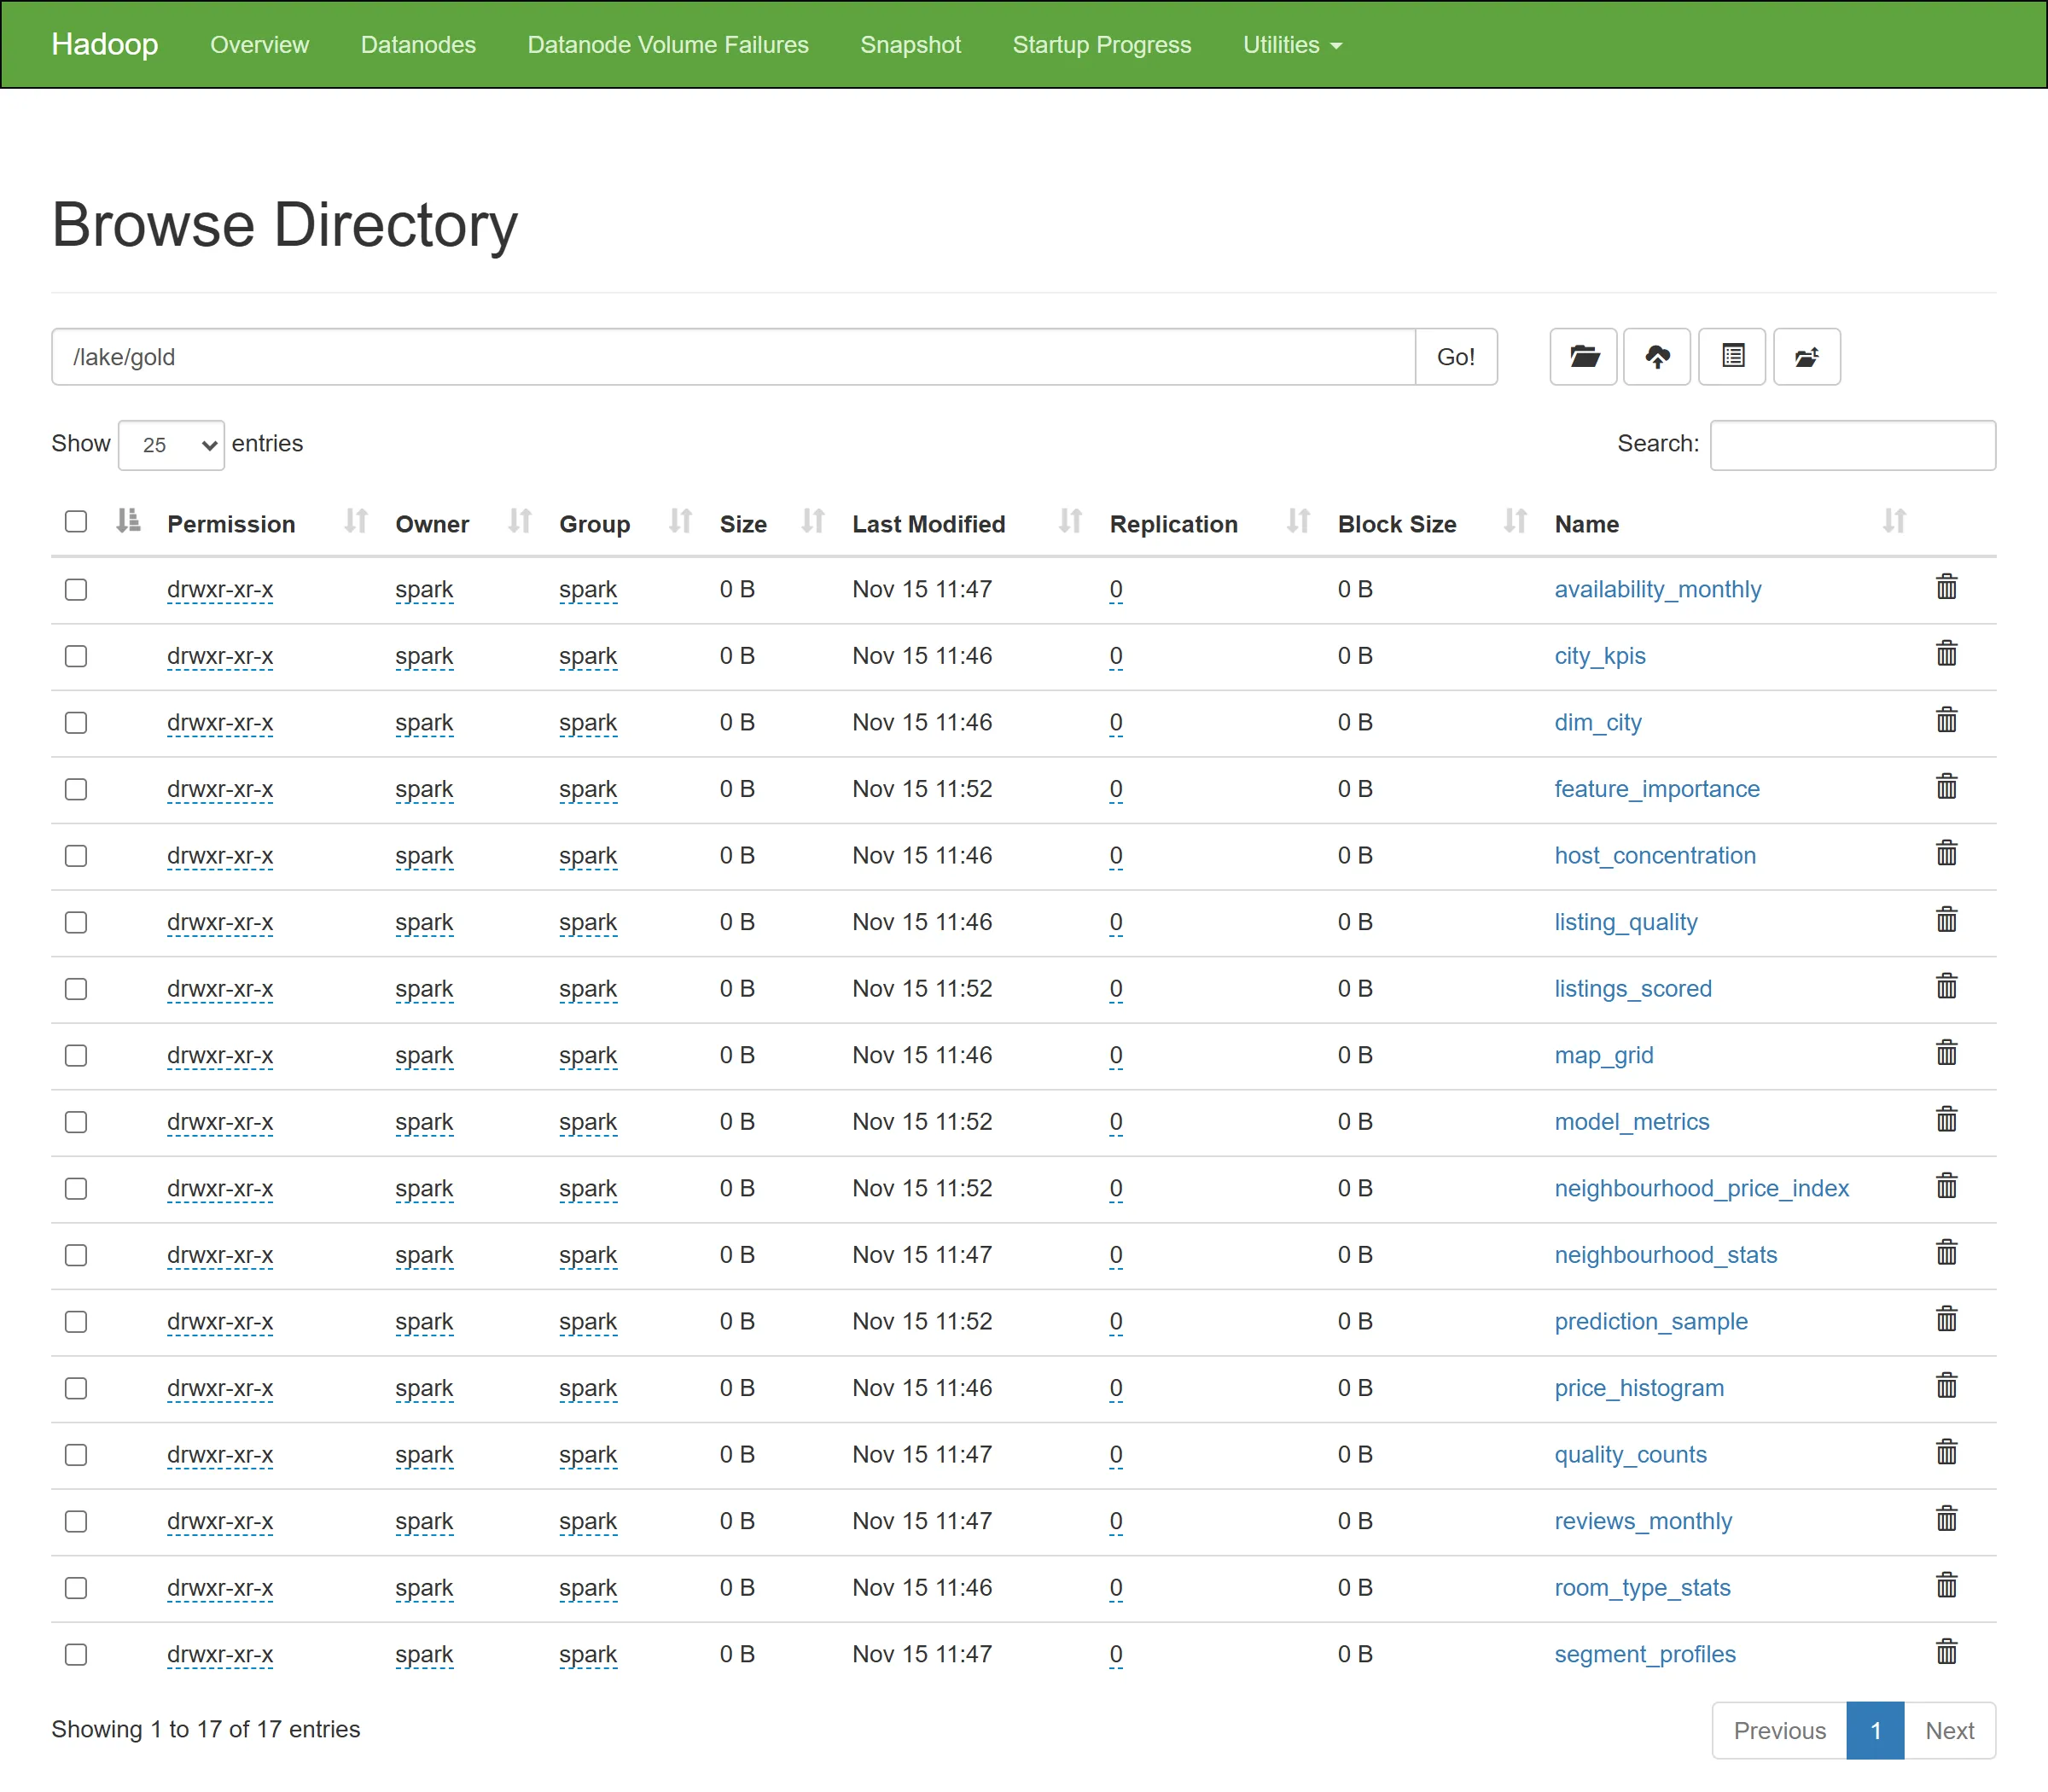
/lake/gold       7 MB   17 data marts
Those 17 Gold marts, here in the NameNode file browser, are all that reaches the site:
The price model
A gradient-boosted trees model (Spark ML’s GBT) predicts the logarithm of the nightly price from the city, location, size, room type, amenities, host and reviews. On the 20% of listings held out for testing, 69,100 listings, it reaches an R² of 0.83 and a median relative error of 20.1%. The baseline rule, which predicts the median of each city and room type, stays at 0.54 and 34.5%.
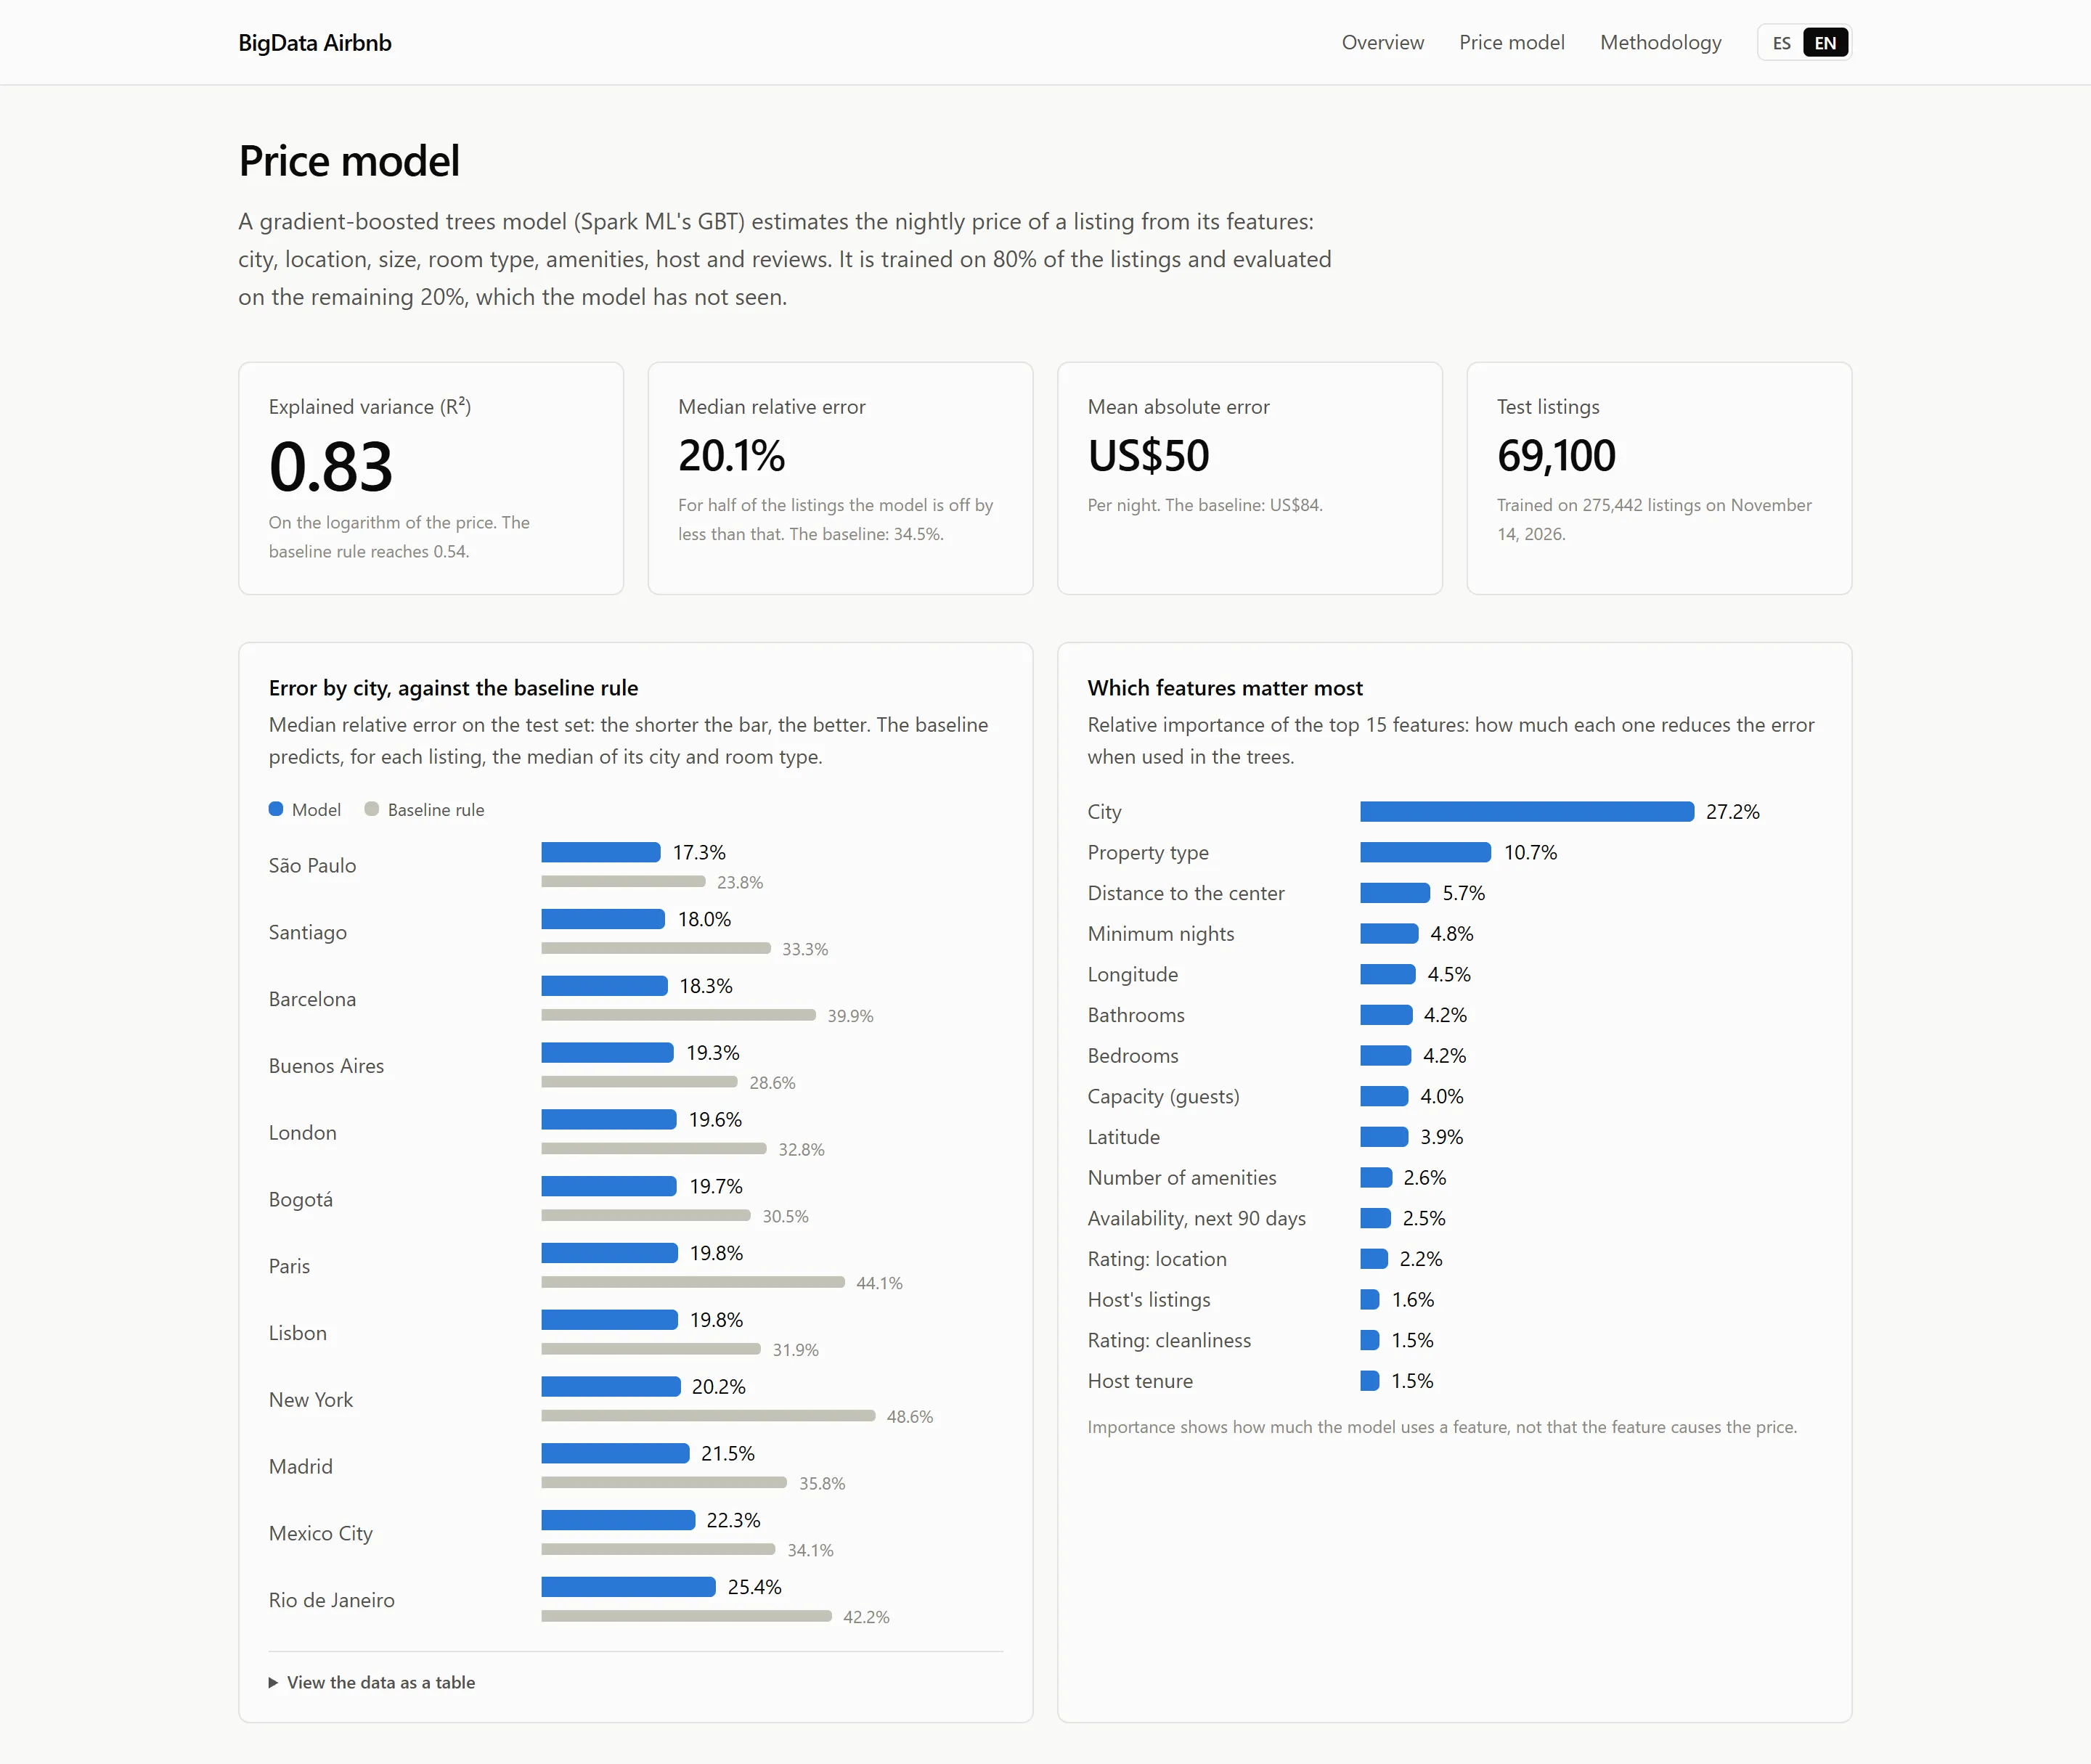
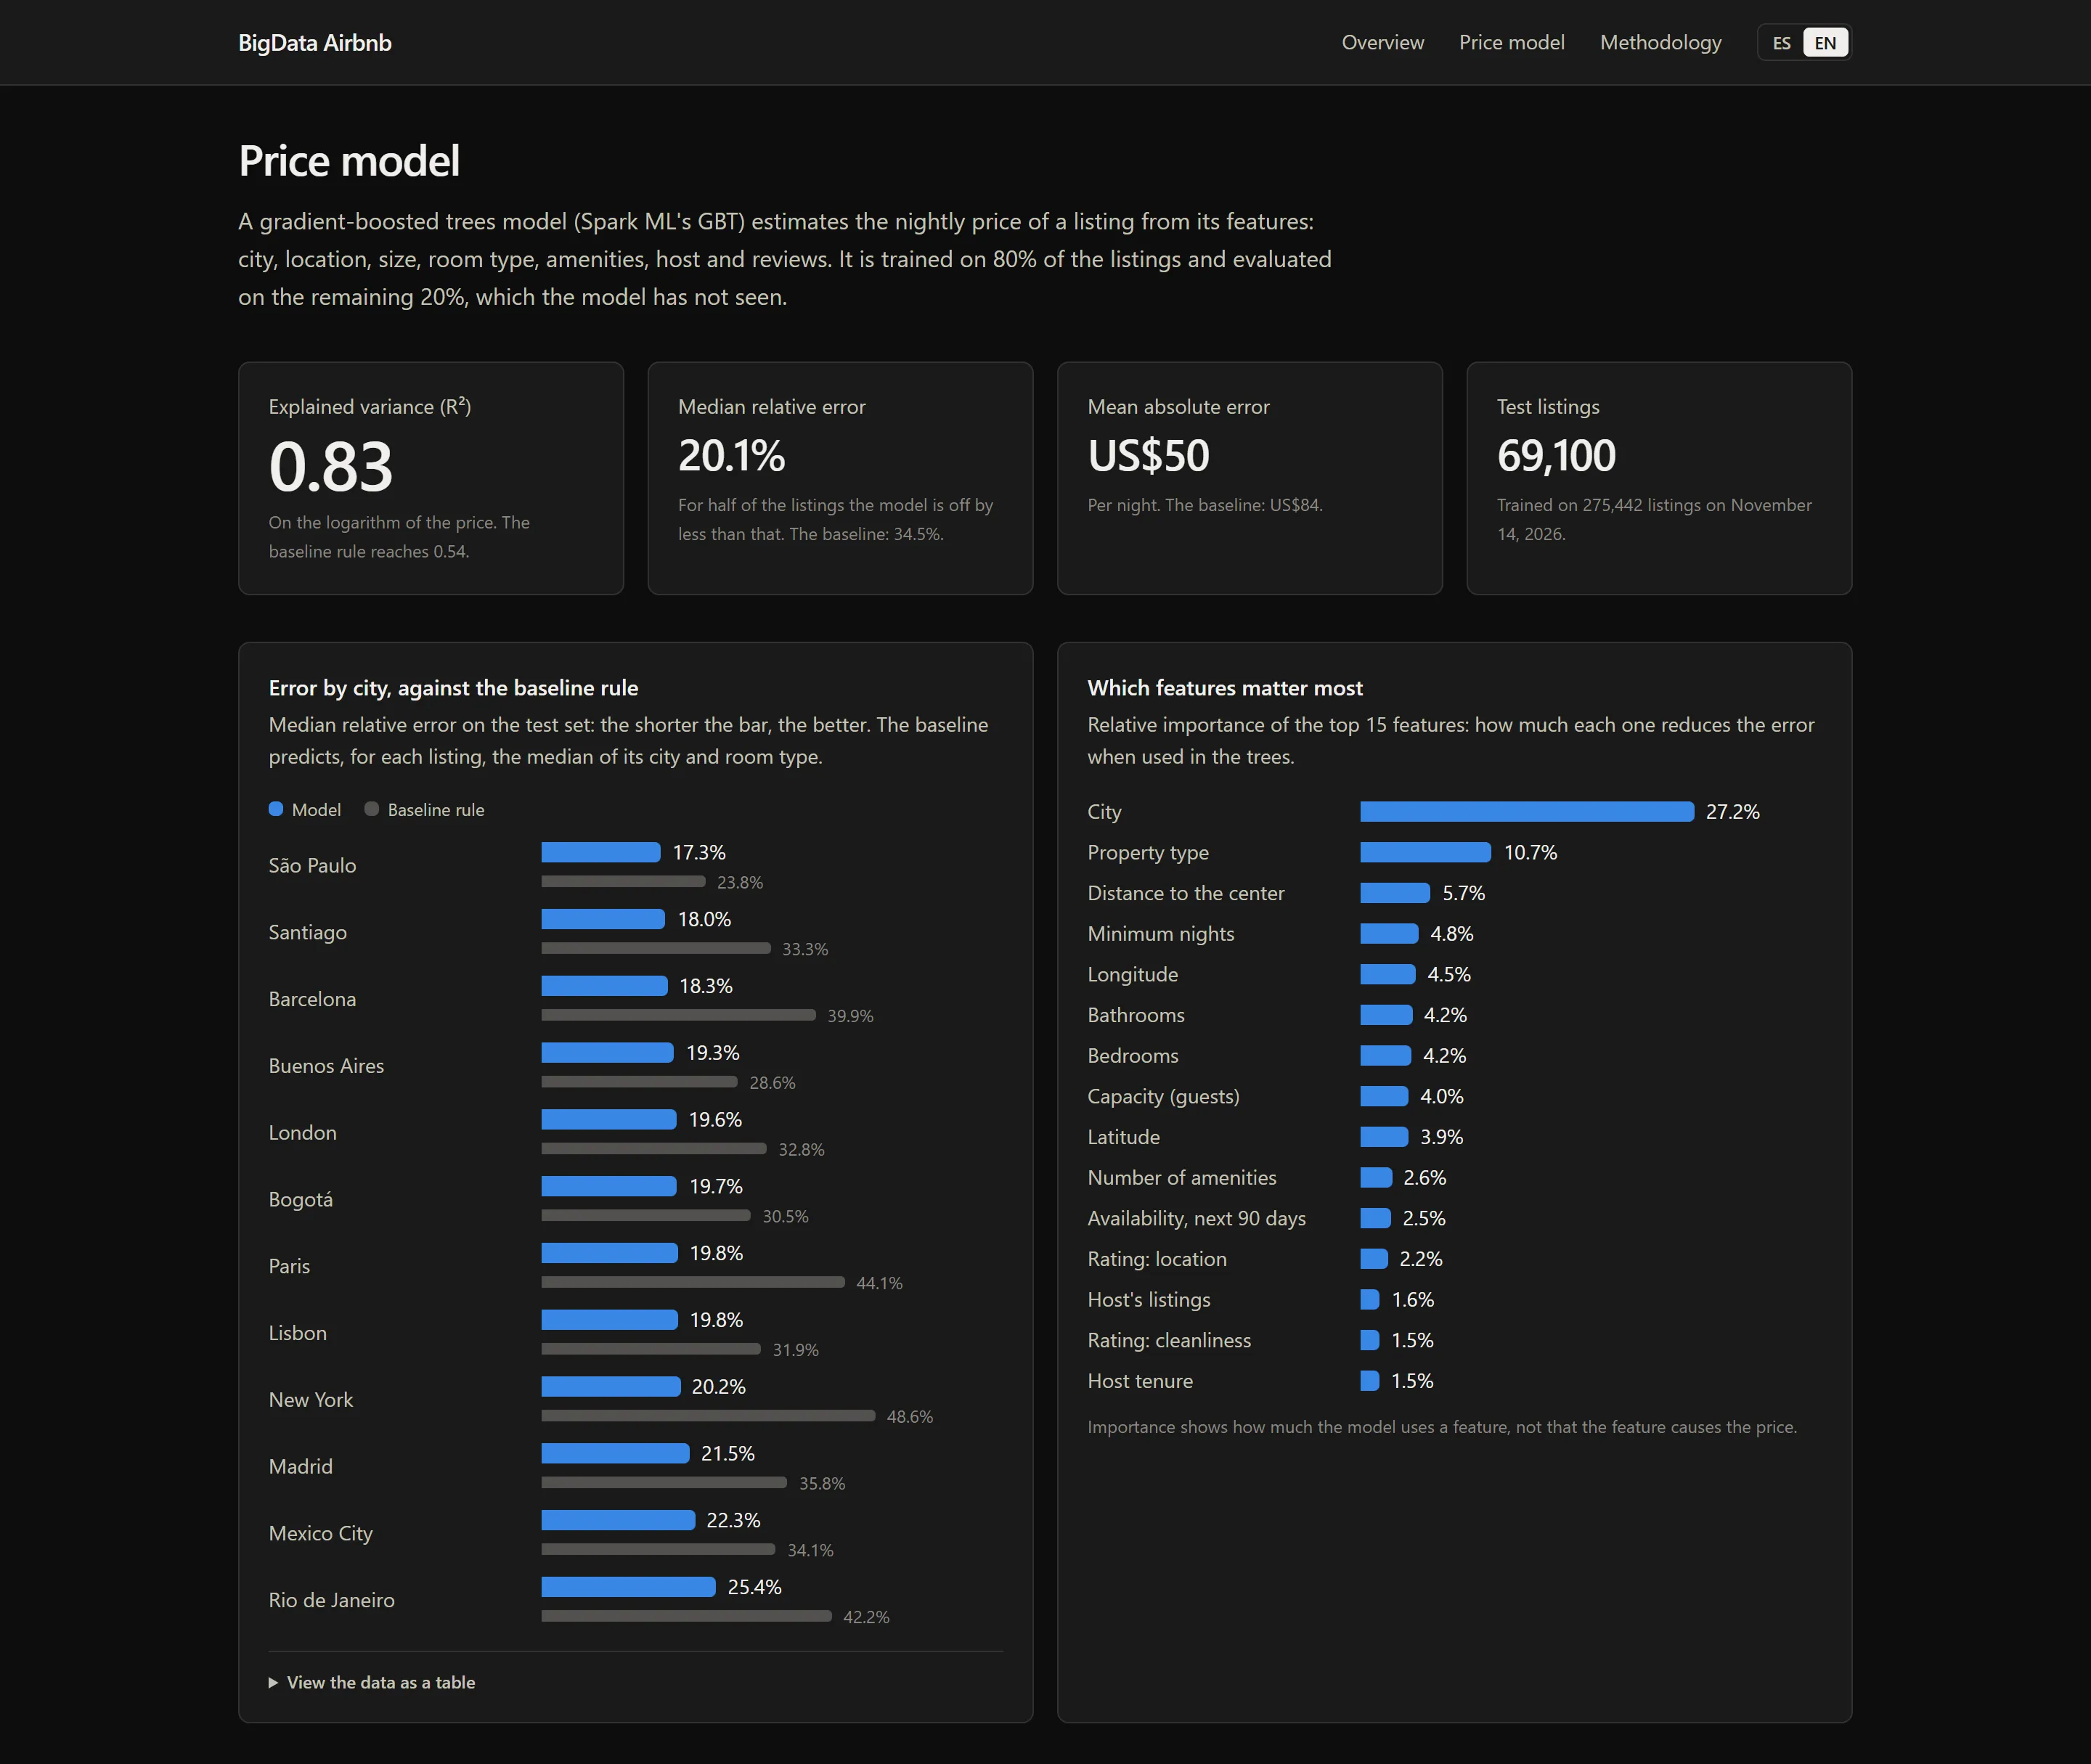
No feature is derived from the price: there is an explicit list of forbidden columns and a test that checks it. The split between training and test is deterministic, by a hash of the identifier, so a listing always falls in the same set.
The model is not equally accurate across the range. It overshoots on the cheapest listings and falls short on the most expensive ones, and the site shows it with a chart of bias by price bracket. In addition, a K-Means groups the neighborhoods of all cities by relative price, review activity, availability and type of supply; the number of groups is chosen with the silhouette coefficient.
The dashboard
The site is built with Next.js and TypeScript. Pages are pre-rendered from the marts and served from cache, so a normal visit runs no query. When it finishes publishing, the pipeline calls a revalidation endpoint and the pages are regenerated on the next visit. The site connects to the database with a read-only role.
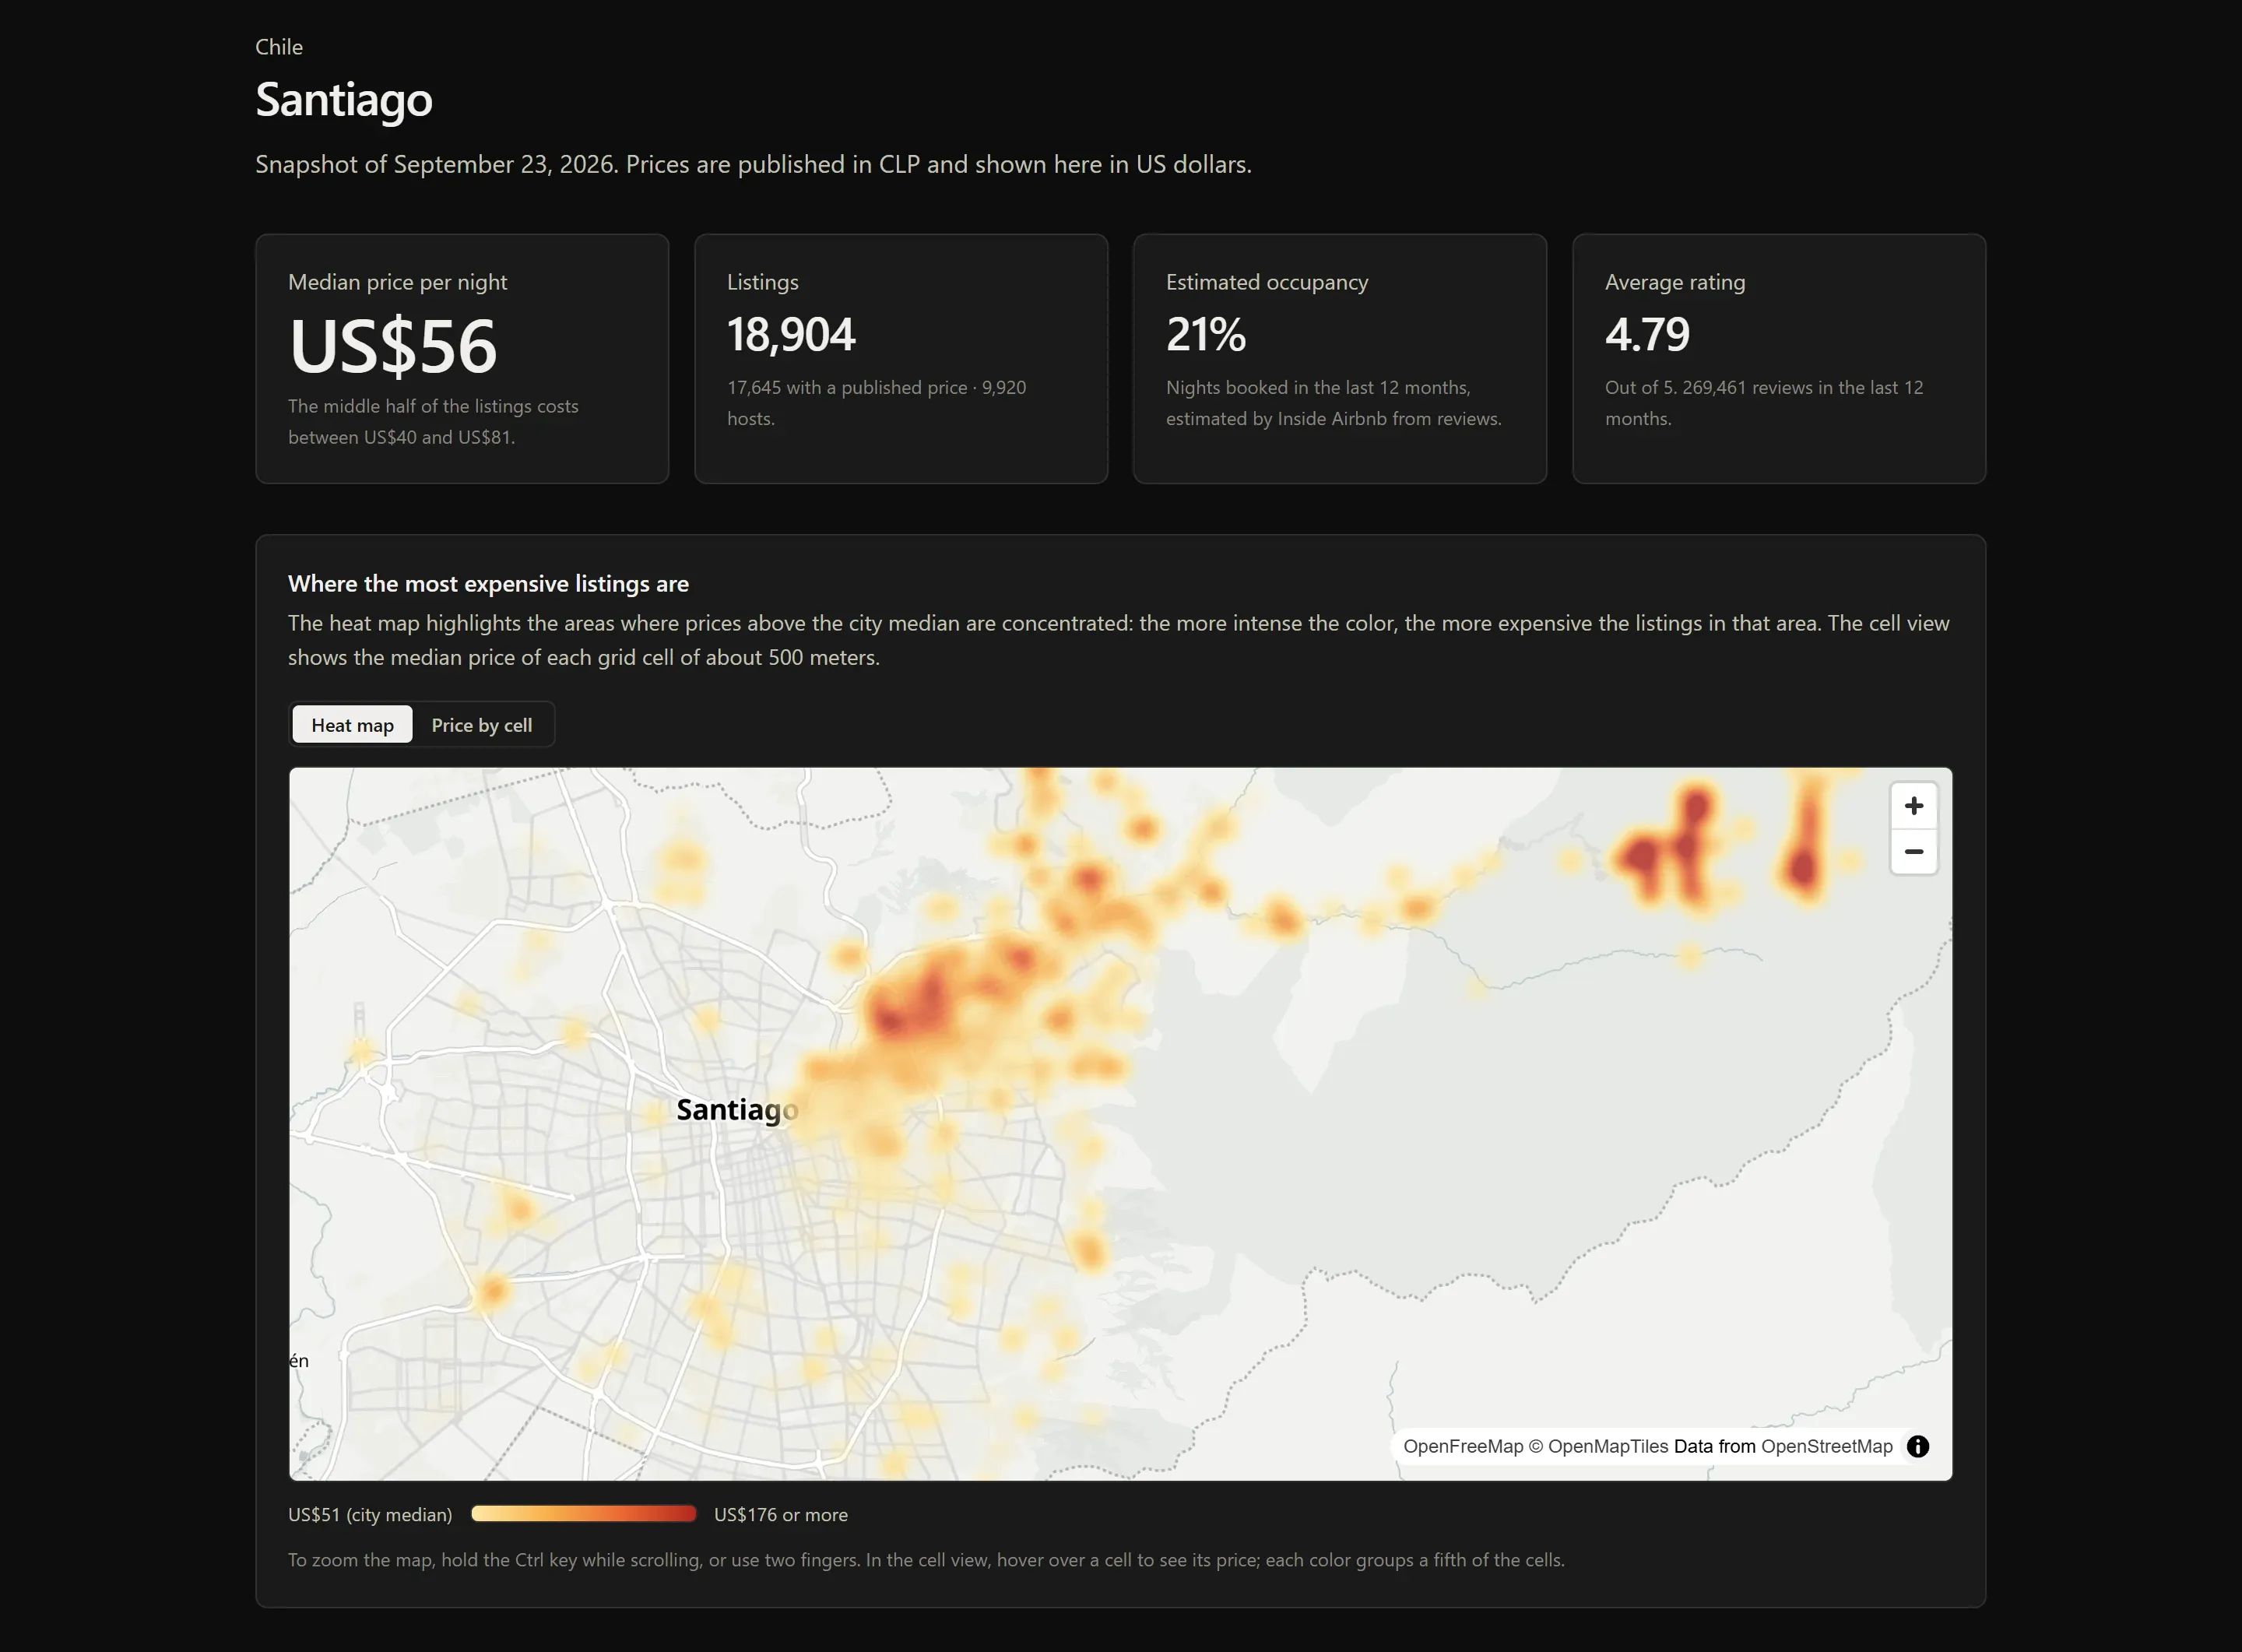
Each city has its own page, with a price map on MapLibre GL that switches between a heat map and the price per cell of about 500 meters:
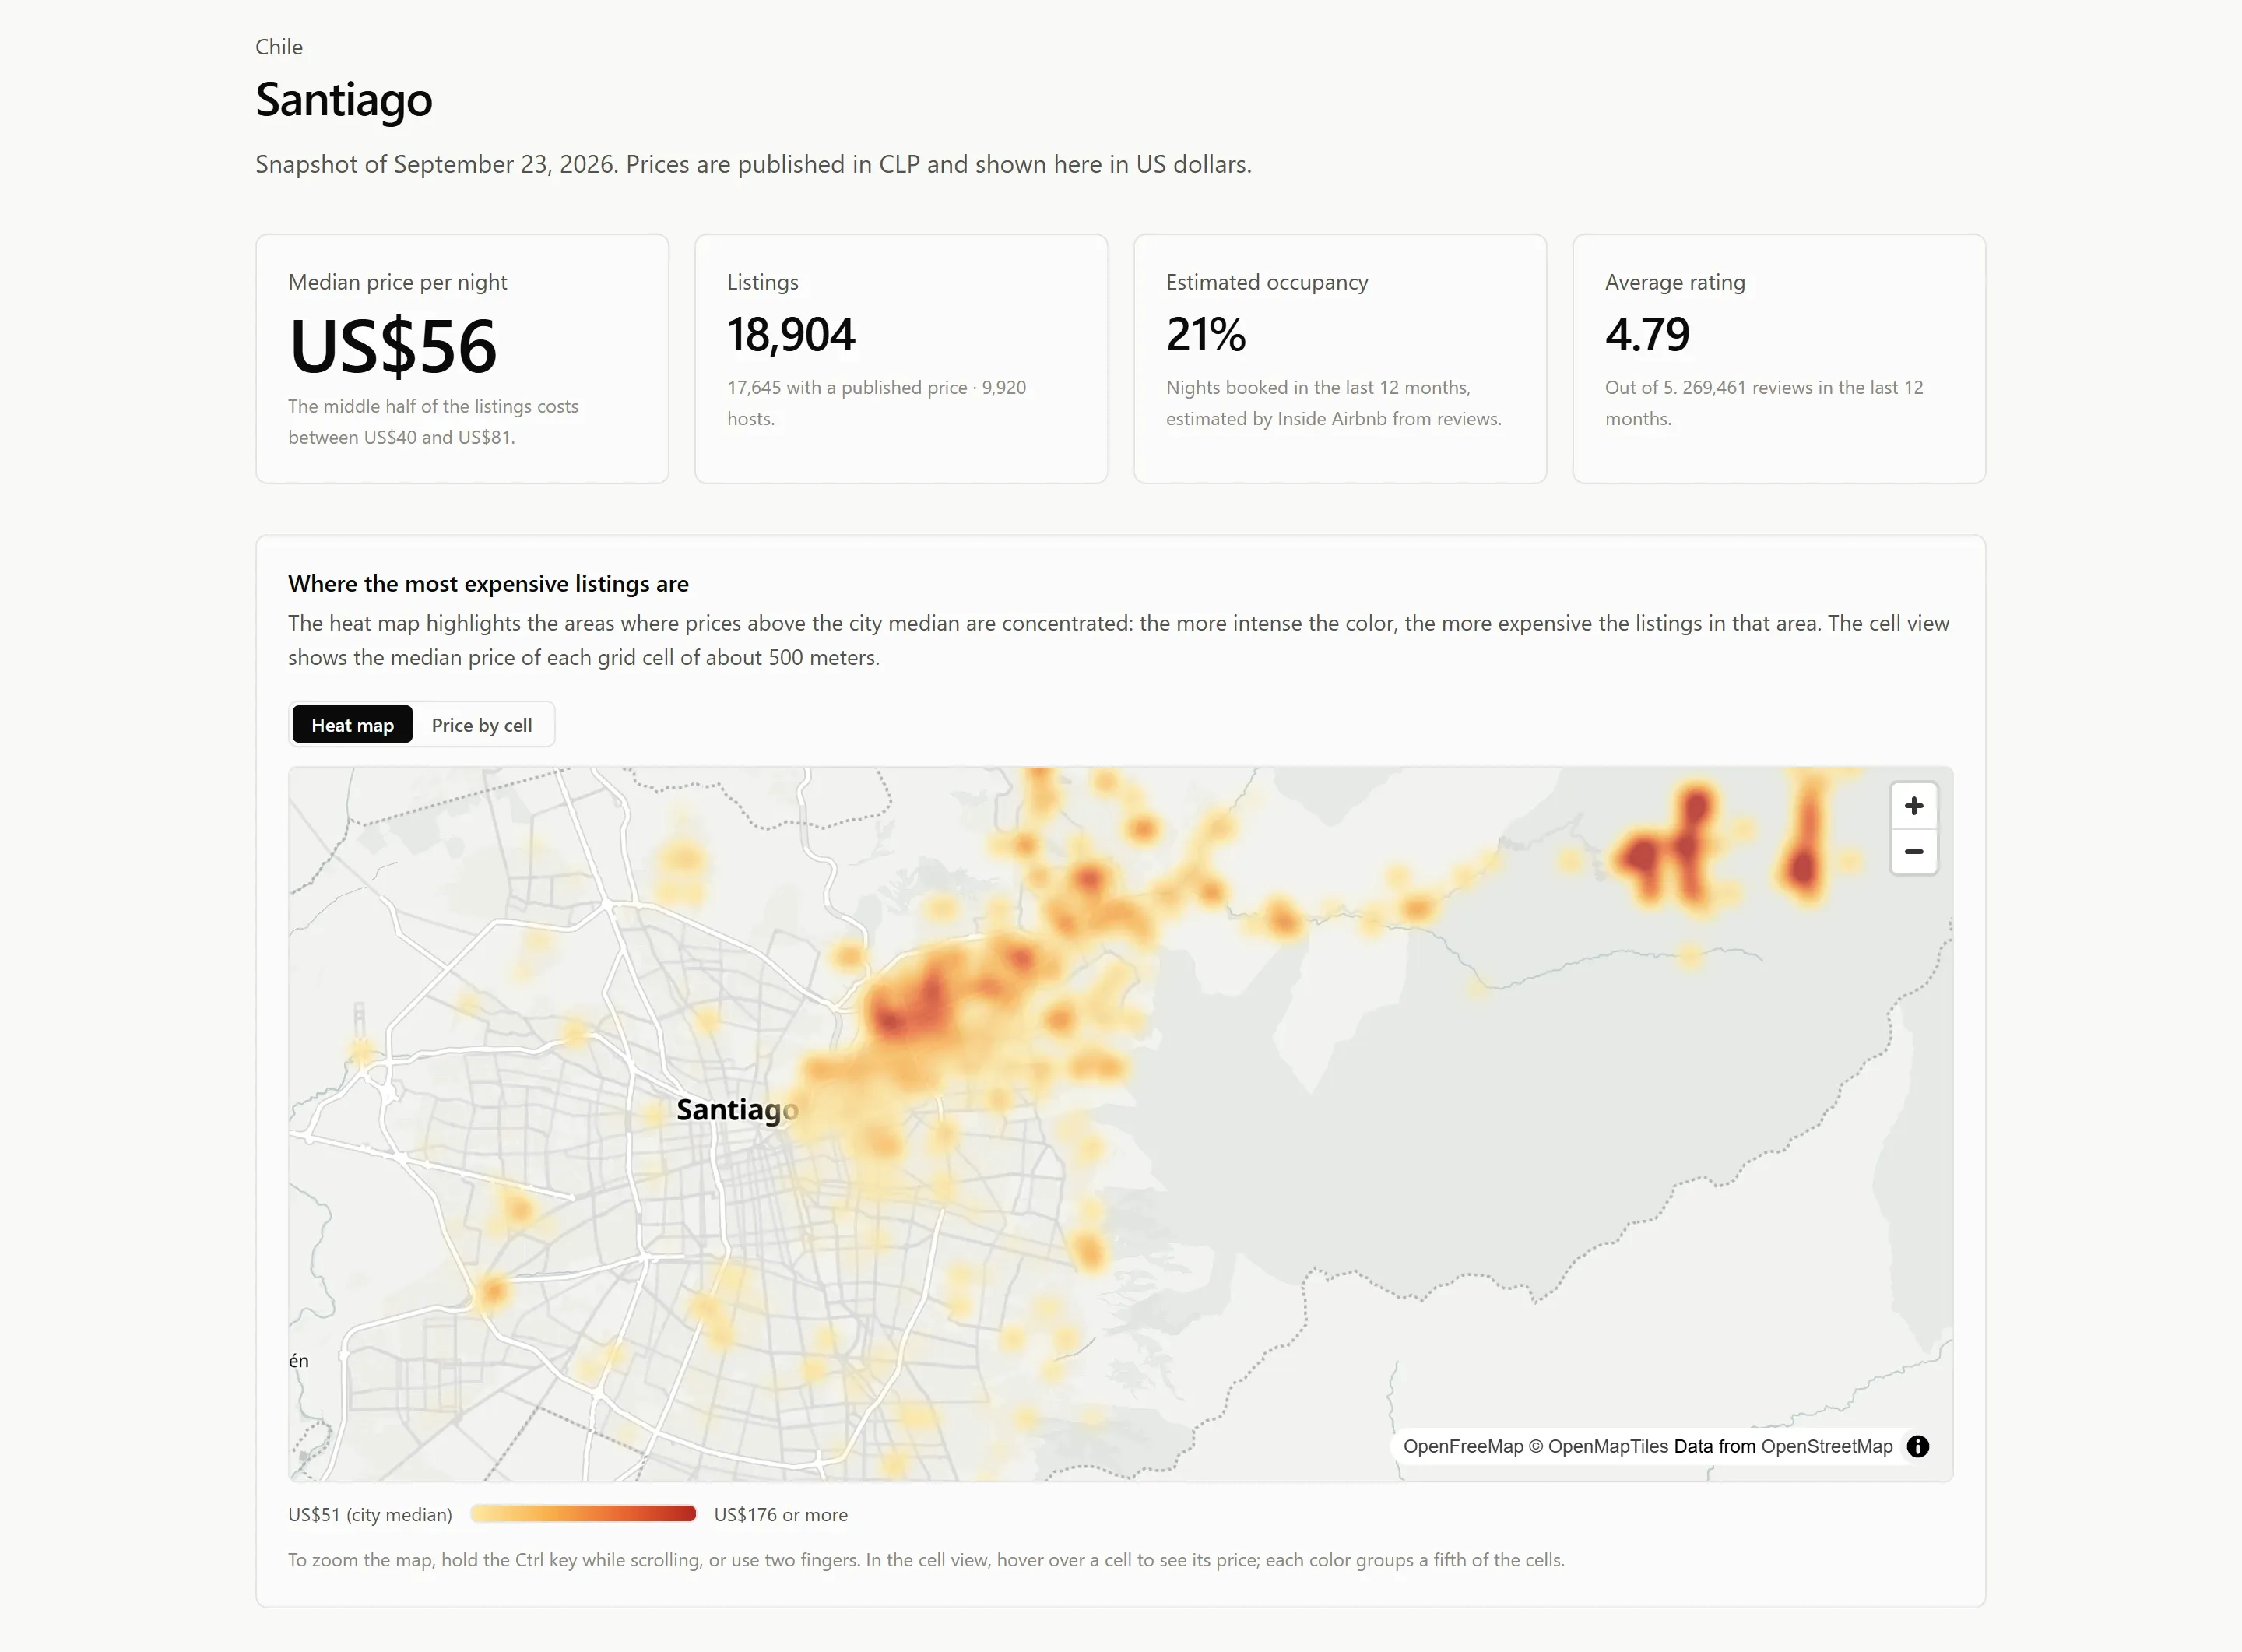
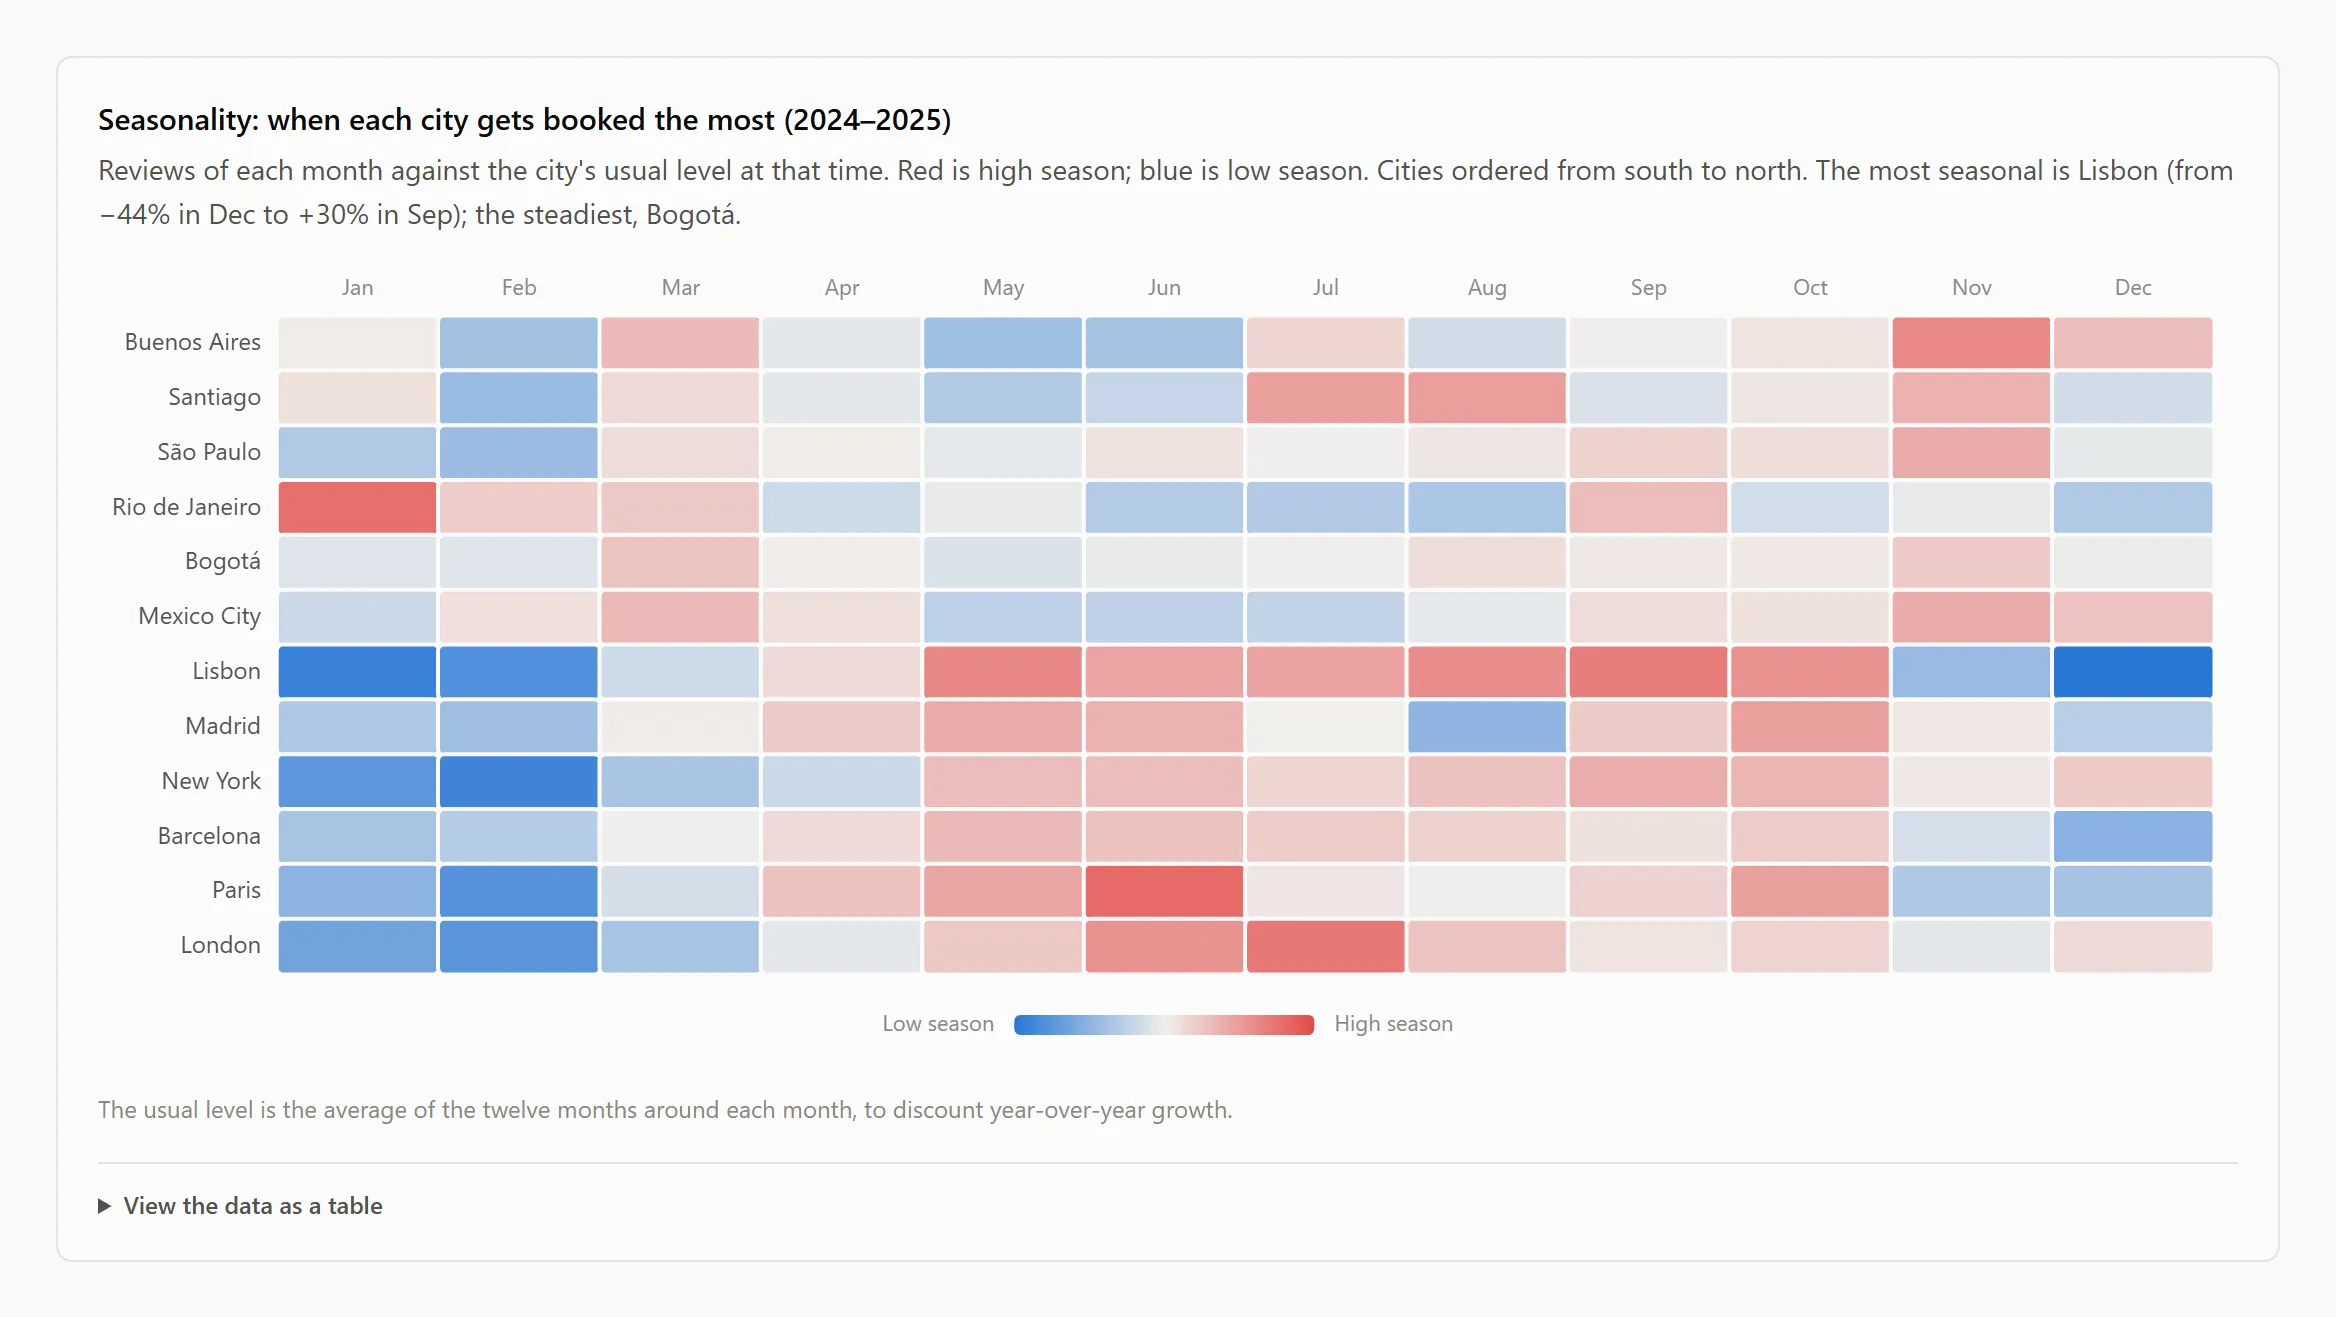
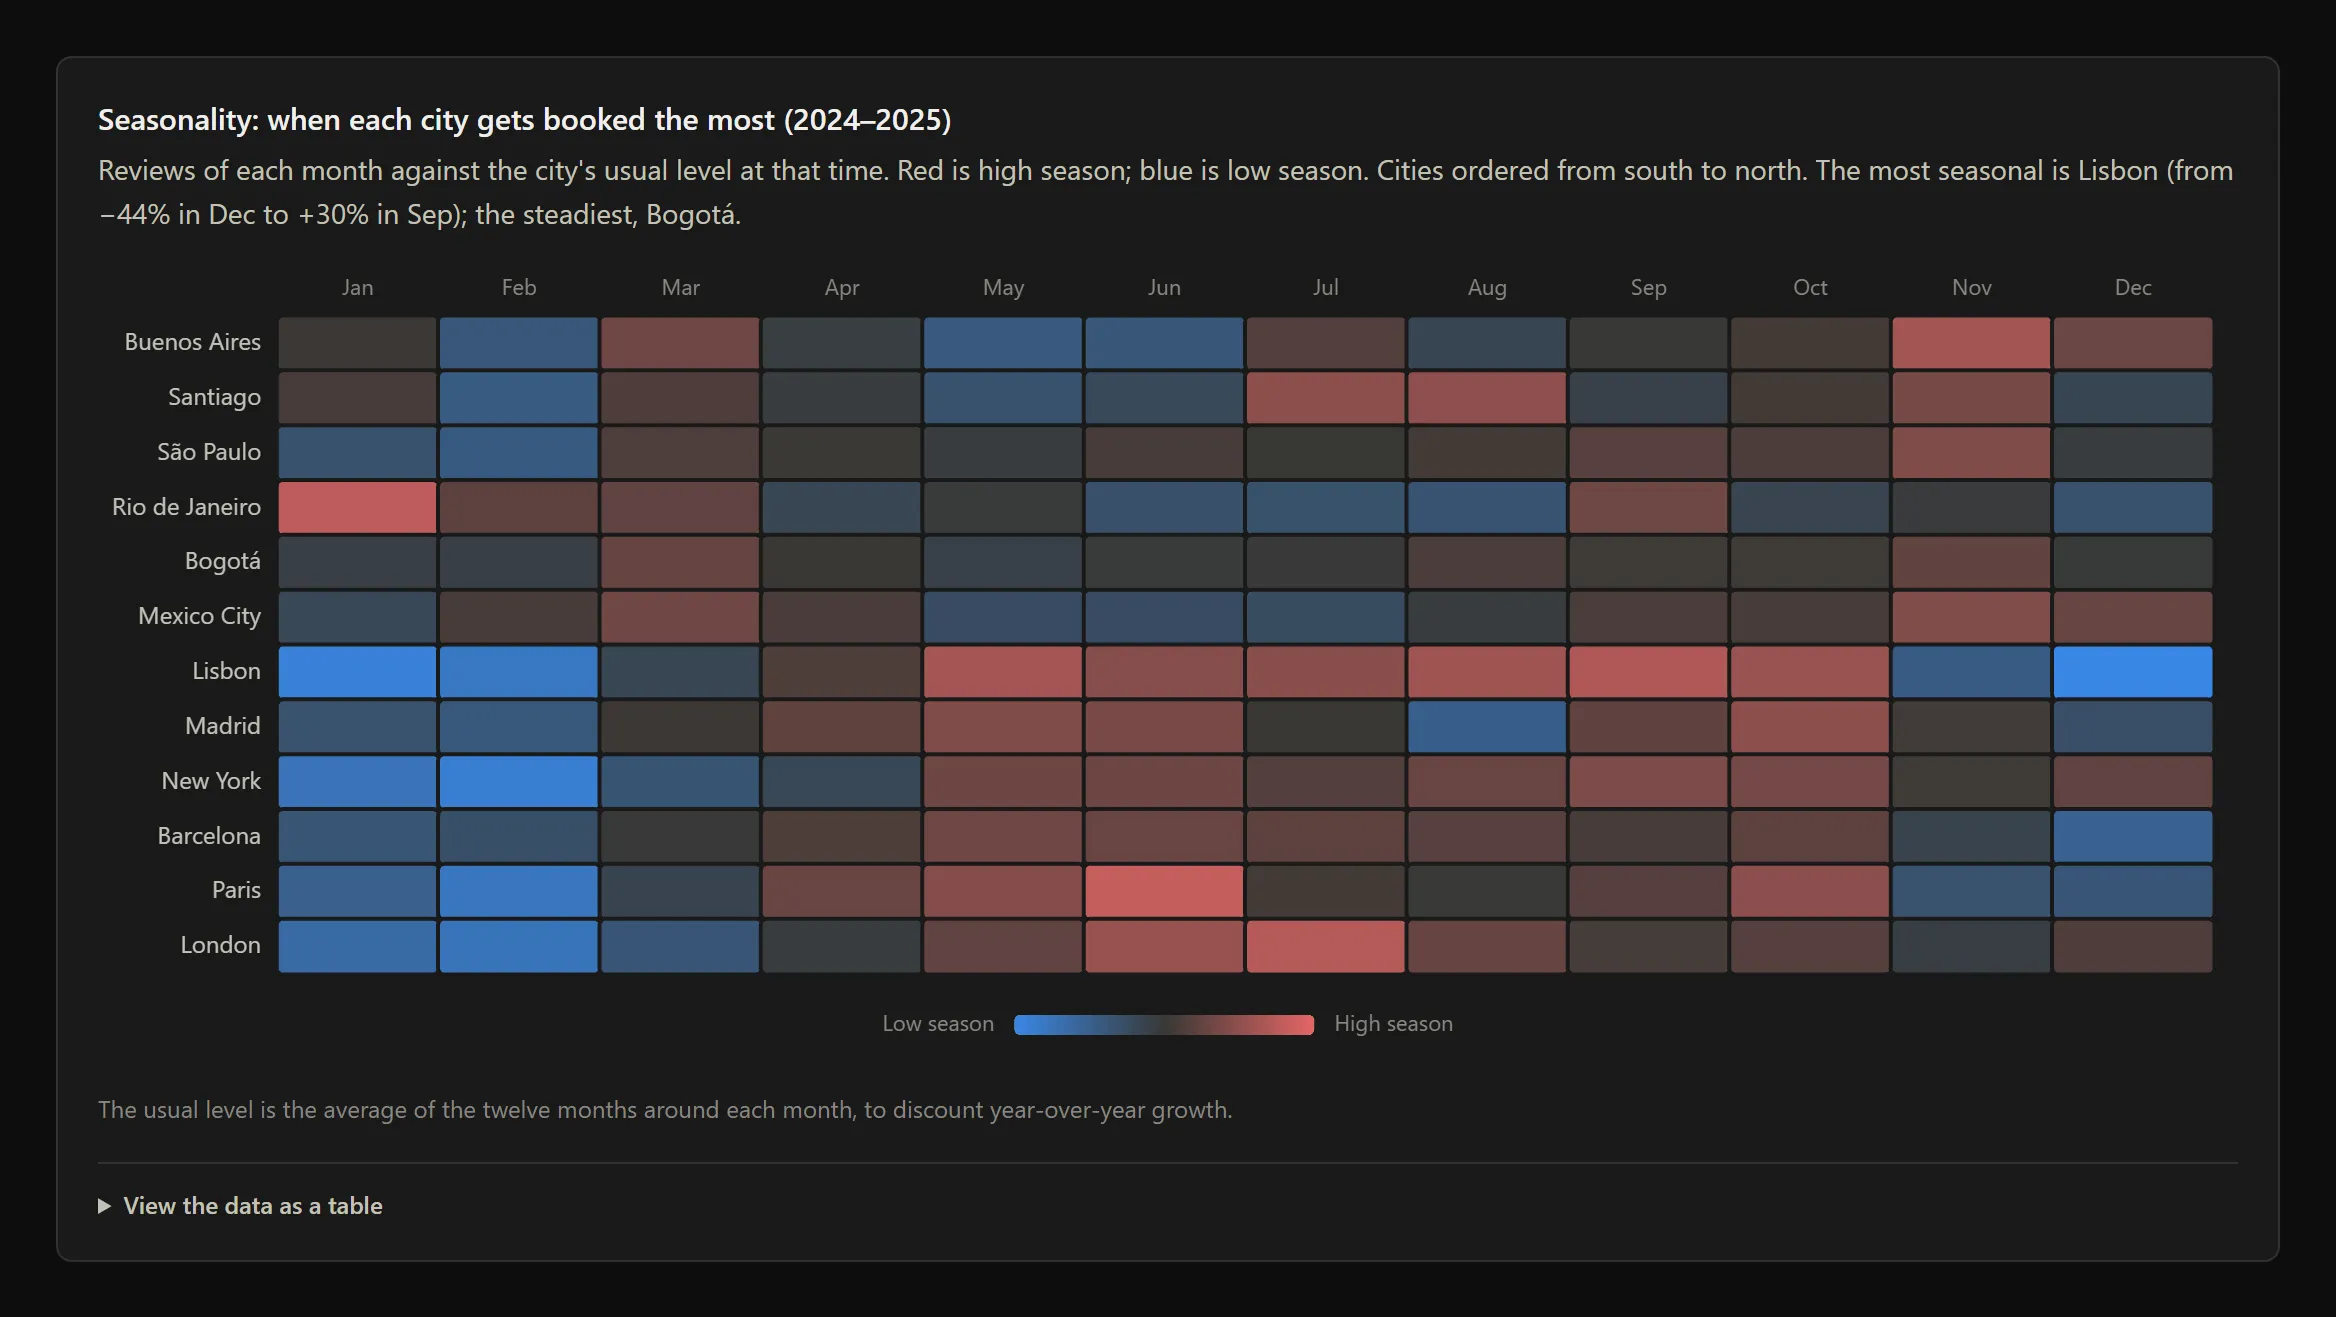
The charts use Apache ECharts, loaded separately so it stays out of the initial JavaScript of every page. Each chart has an equivalent table, so no value depends only on color or on hovering, and the palette is validated for color blindness in light and dark mode.
The language is part of the URL, with translated routes, and is not stored in cookies.
Quality and delivery
- Tests. 94 tests with pytest and Spark in local mode, including a full run over a temporary lake and the publication to PostgreSQL, which checks that the load is atomic and that the read-only role has the right permissions.
- Static analysis.
ruffand strictmypyon the pipeline; ESLint and TypeScript on the site. - CI. GitHub Actions runs lint, types and tests for the pipeline, and lint, types and build for the dashboard, on every pull request.
- Smoke tests. Playwright walks the site on desktop, in dark mode and on mobile, and the same tests can run against the deployed site.
- Infrastructure. The database on Neon, the project on Vercel and the DNS are defined with Terraform in a separate repository.
From the original version to the current one
- From one city with an 18-column summary CSV to 12 cities with the detailed 90-column files, the calendar and the reviews.
- From loading each CSV into memory with pandas and resending it row by row through Kafka to a streaming download straight into the lake.
- From no Silver layer and no partitioning, with duplicated data on every rerun, to persisted, partitioned and idempotent layers.
- From a model with an R² close to zero to one at 0.83 with no target leakage.
- From opening a Parquet file by hand in Power BI to a website with pre-aggregated data and caching.
- From no tests to 94 tests, strict types and CI.
The code of the first version is kept in the legacy/ folder of the repository, with its authorship.
Limits
- Prices are the advertised ones, and many listings do not publish a price (in Paris, 44%). The price statistics and the model use only the ones that do.
- The conversion to US dollars uses a fixed exchange rate, so that repeating a run gives the same result.
- Occupancy is an estimate by Inside Airbnb based on reviews.
- The local cluster has a single DataNode, with no replicas: it is good for developing and demonstrating, not for keeping data.
The data comes from Inside Airbnb and is used under the CC BY 4.0 license. The site publishes only aggregates, with no host names or review text. The project is independent and is not affiliated with Airbnb or Inside Airbnb.